Case Studies
Discover GeoSpectra’s case studies highlighting how satellite imagery and geospatial technologies drive efficient mineral targeting, drilling decisions, and deposit modelling from regional to prospect scale.

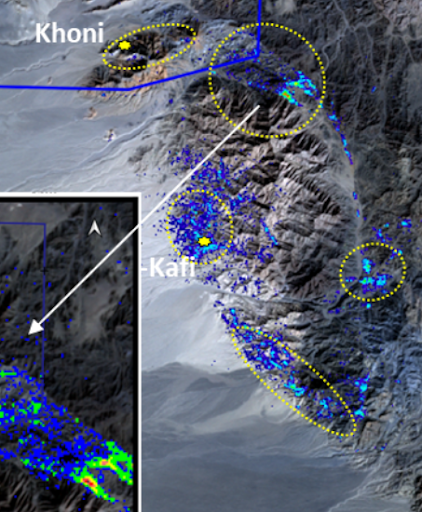
Targeting copper- gold mineralization by analysis of ASTER and Sentinel 2A Imagery
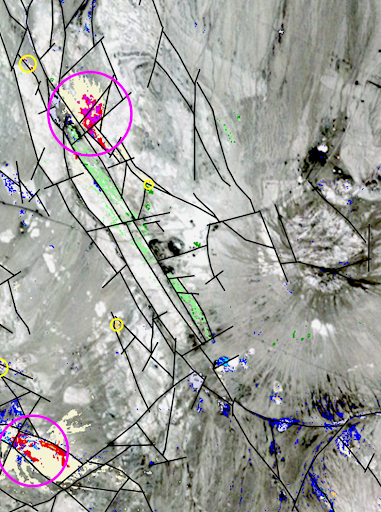
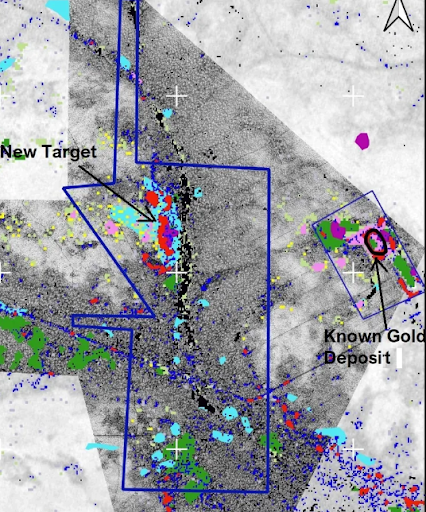
Targeting gold mineralization by analysis of hyperspectral EnMap Imagery (district-scale mineral and
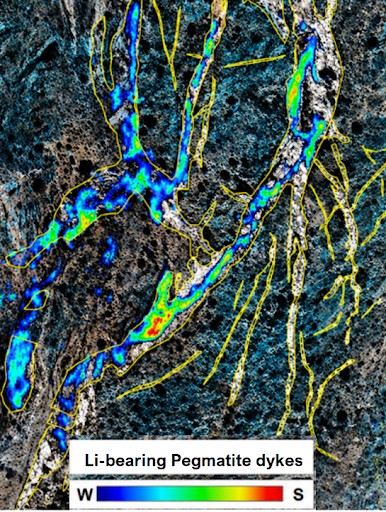
Targeting lithium mineralization by analysis of Worldview-3 Imagery

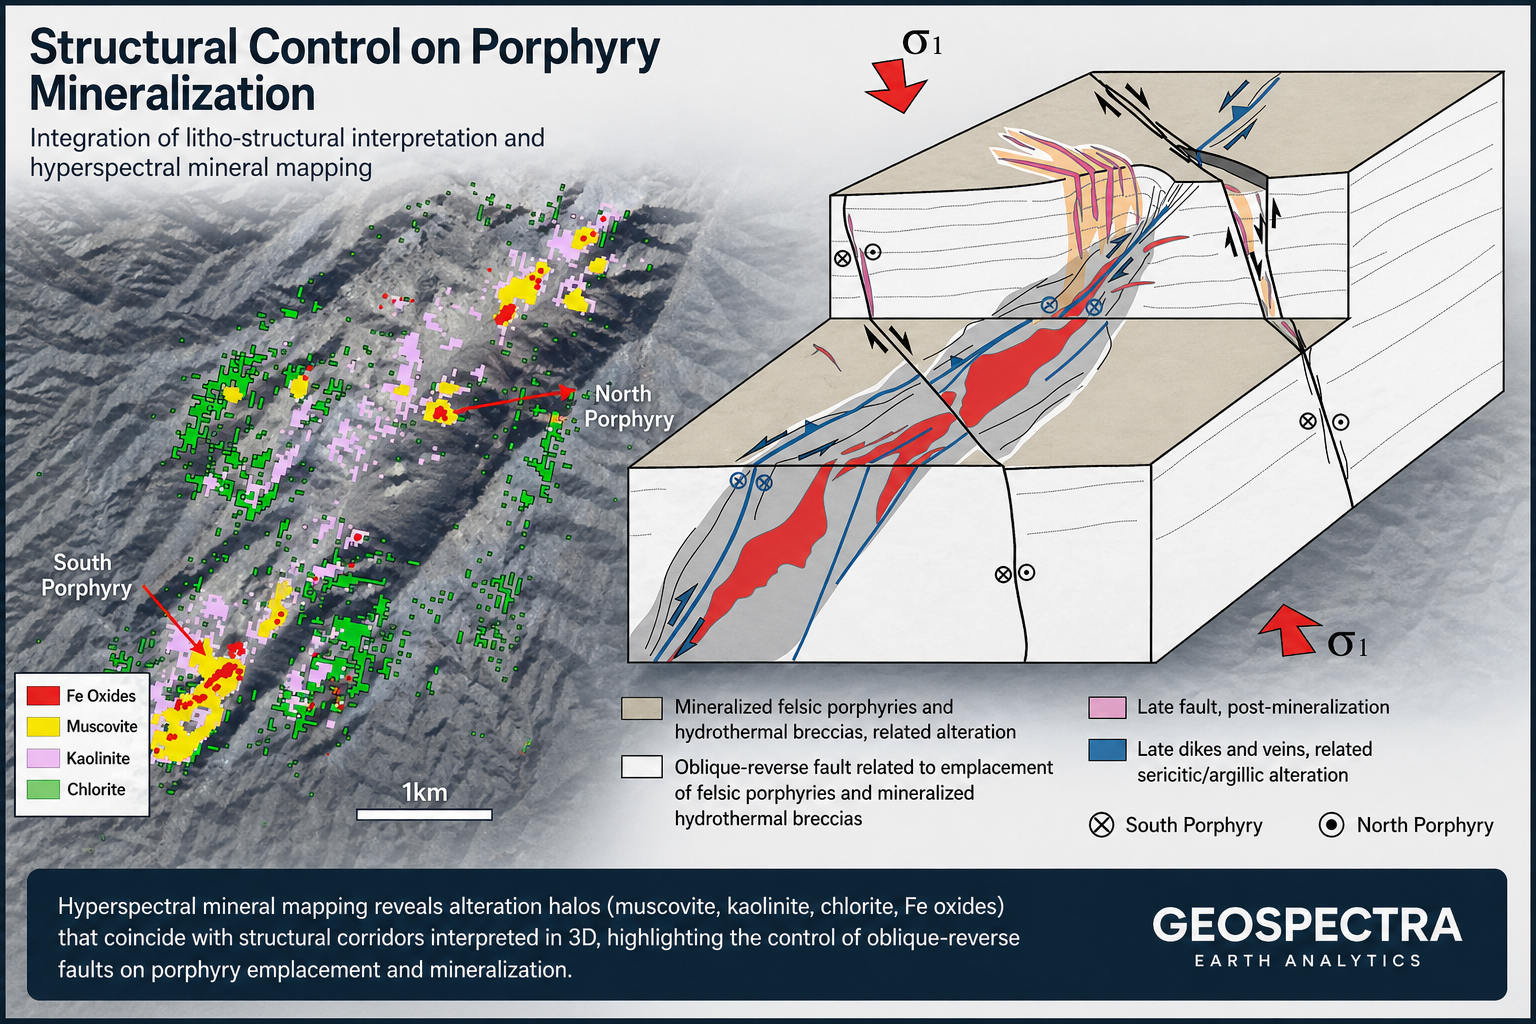
Targeting Cu-Au porphyry mineralization by analysis of hyperspectral Prisma and Sentinel-2A Imagery
Tenement Revaluation