
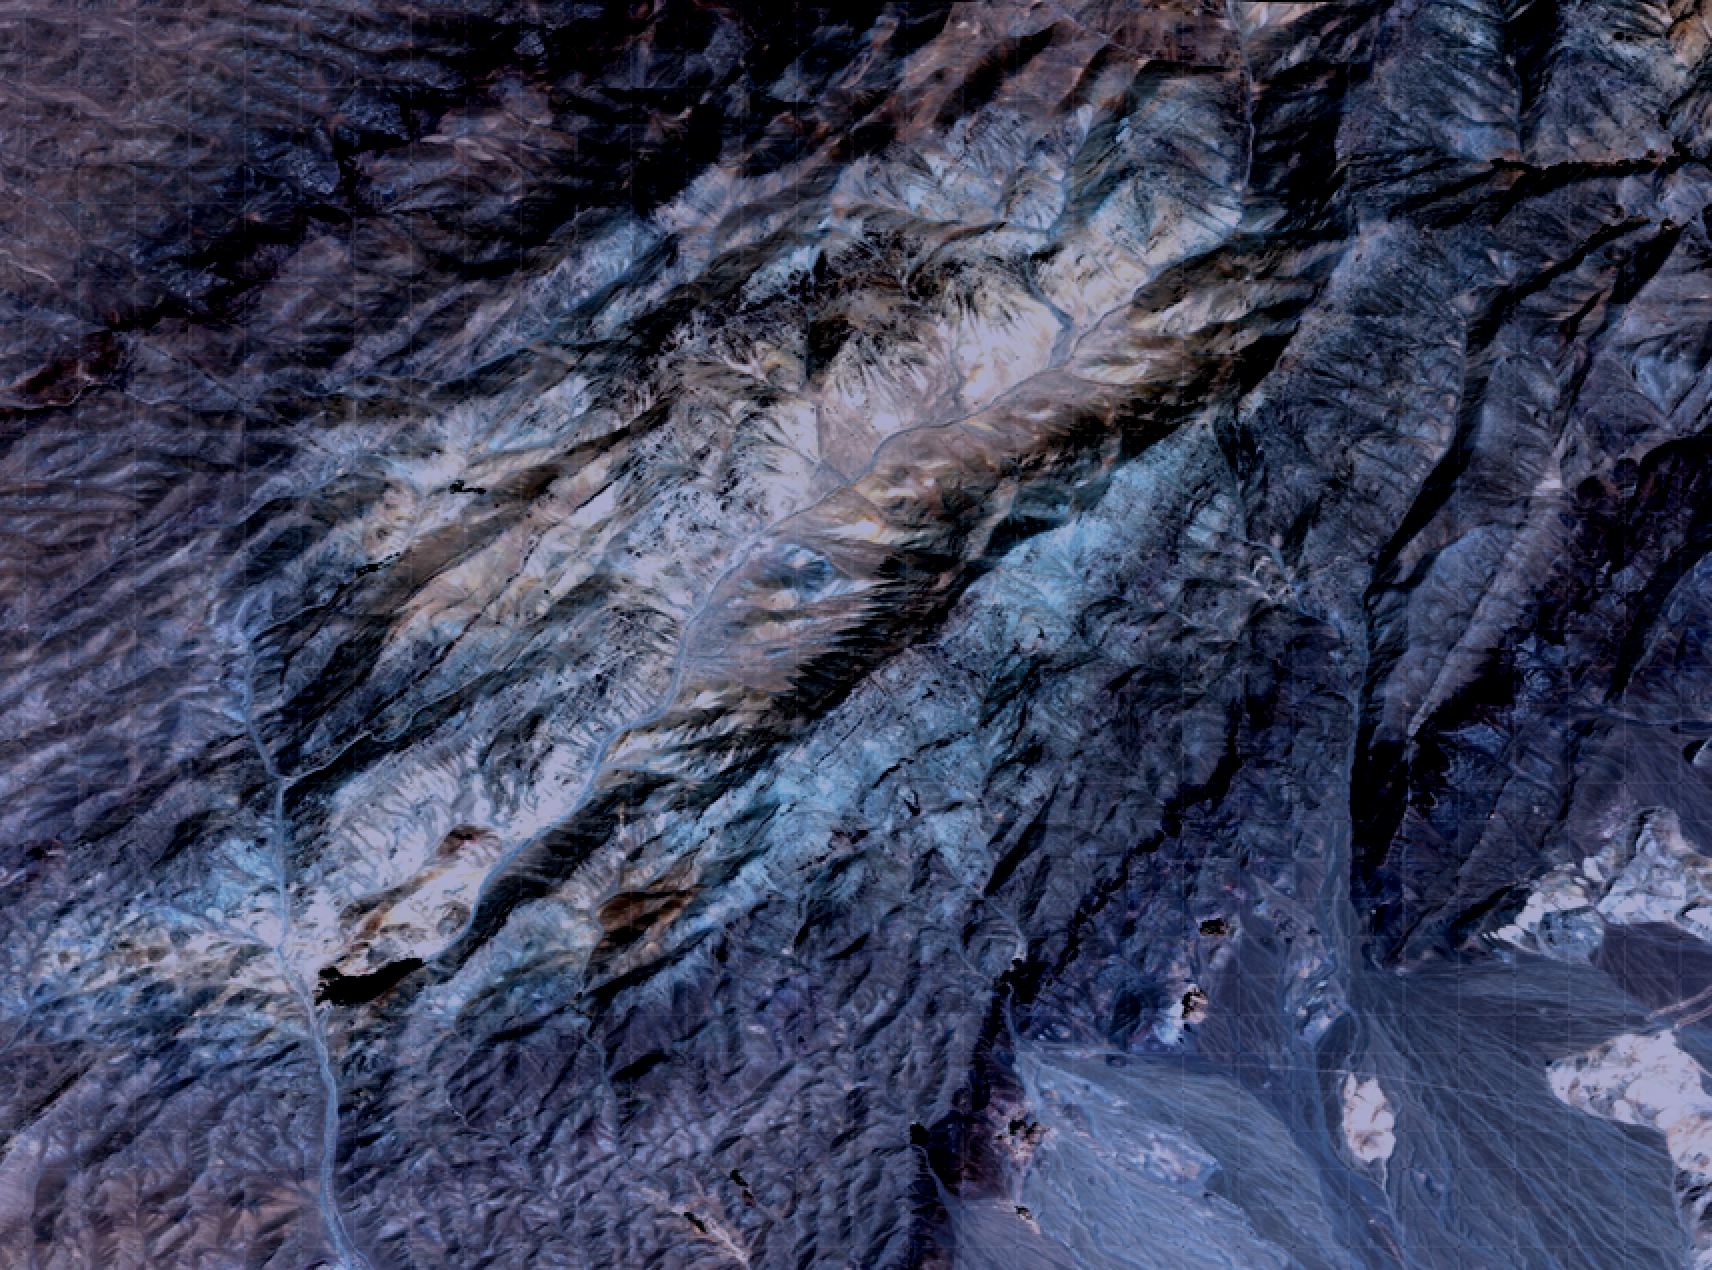
Overview of the Projects
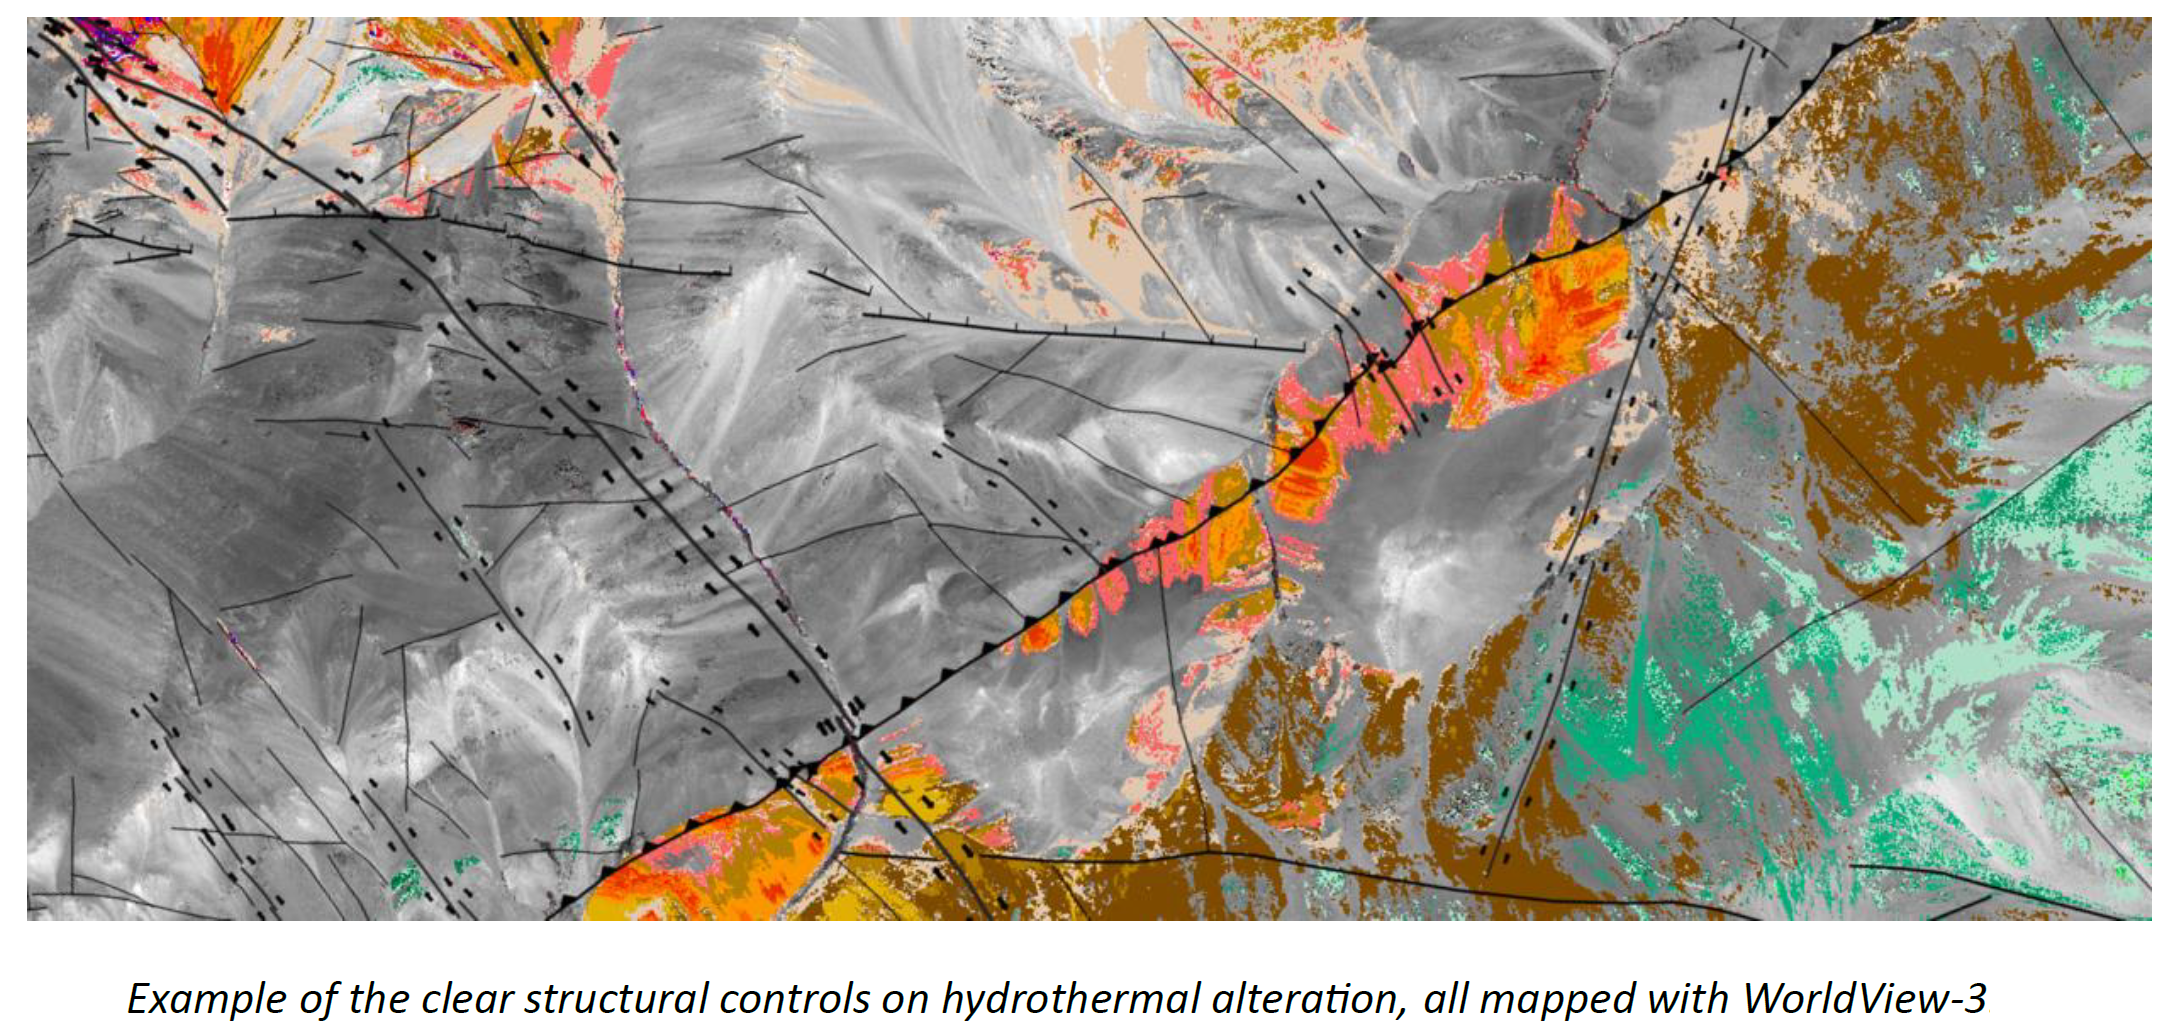
Spectral Analysis
Access Processing Multi- and hyperspectral imagery for mineral and structural mapping and ground target generation
GeoSpectra delivers advanced spectral remote sensing, AI-driven geospatial modelling, drilling targeting, and resource estimation. Our work spans precious, base, lithium, and critical metal projects across multiple countries, from regional to deposit scale
Geospatial Modelling
GeoSpectra offers AI drilling target generation, deposit modeling and reserve estimation
Some of the Completed Projects
Spectral Analysis of Satellite Imagery Data Integrated with Airborne Magnetic and Geological Data for Mapping Cu-Au Potential Targets on a regional scale
Objective: Identify gold and copper targets for follow-up regional field exploration by using Aster imagery.
Method: Based on the mineral systems of the area (primarily epithermal gold and Cu-Au skarn porphyry), ASTER data (30 m resolution), Sentinel-2A (10 m resolution), and hyperspectral PRISMA data were processed to map indicator Cu-Au minerals. Airborne magnetic data were used to map linear structures. The results were combined with the regional reclassified geological map to identify favourable exploration signatures
Target Identification: Based on key epithermal and skarn-porphyry mineralisation indicators, several targets were mapped for follow-up ground exploration. Indicator gold exploration signatures from spectral remote sensing, magnetic and geological data were extracted and integrated to map several priority areas ranked 1-3 for on-ground exploration. The deliverable data included favourable RGB images, intensity maps of clay, iron oxides, jarosite and silica, as well as mineral map, structural map, and a final target map, along with report and GIS-ready datasets
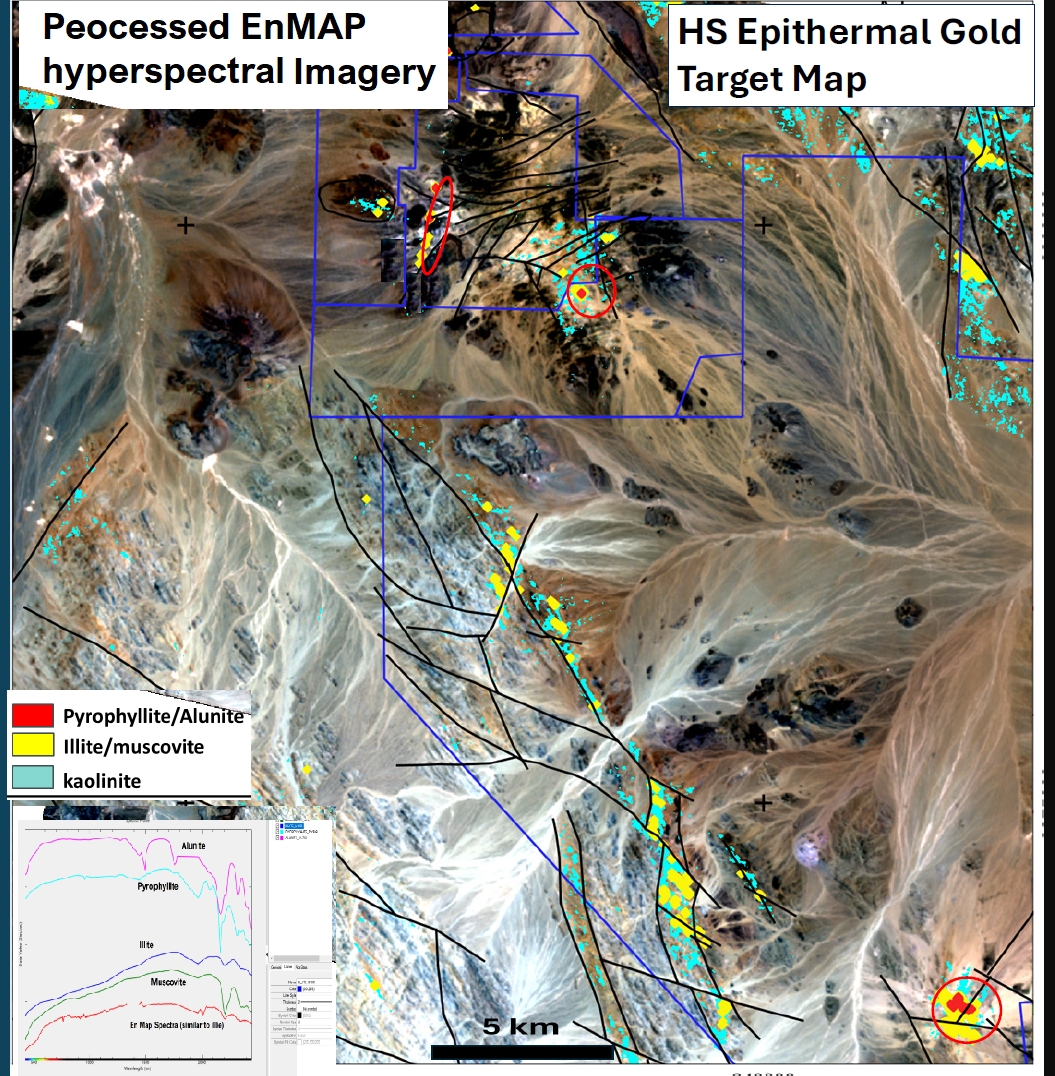
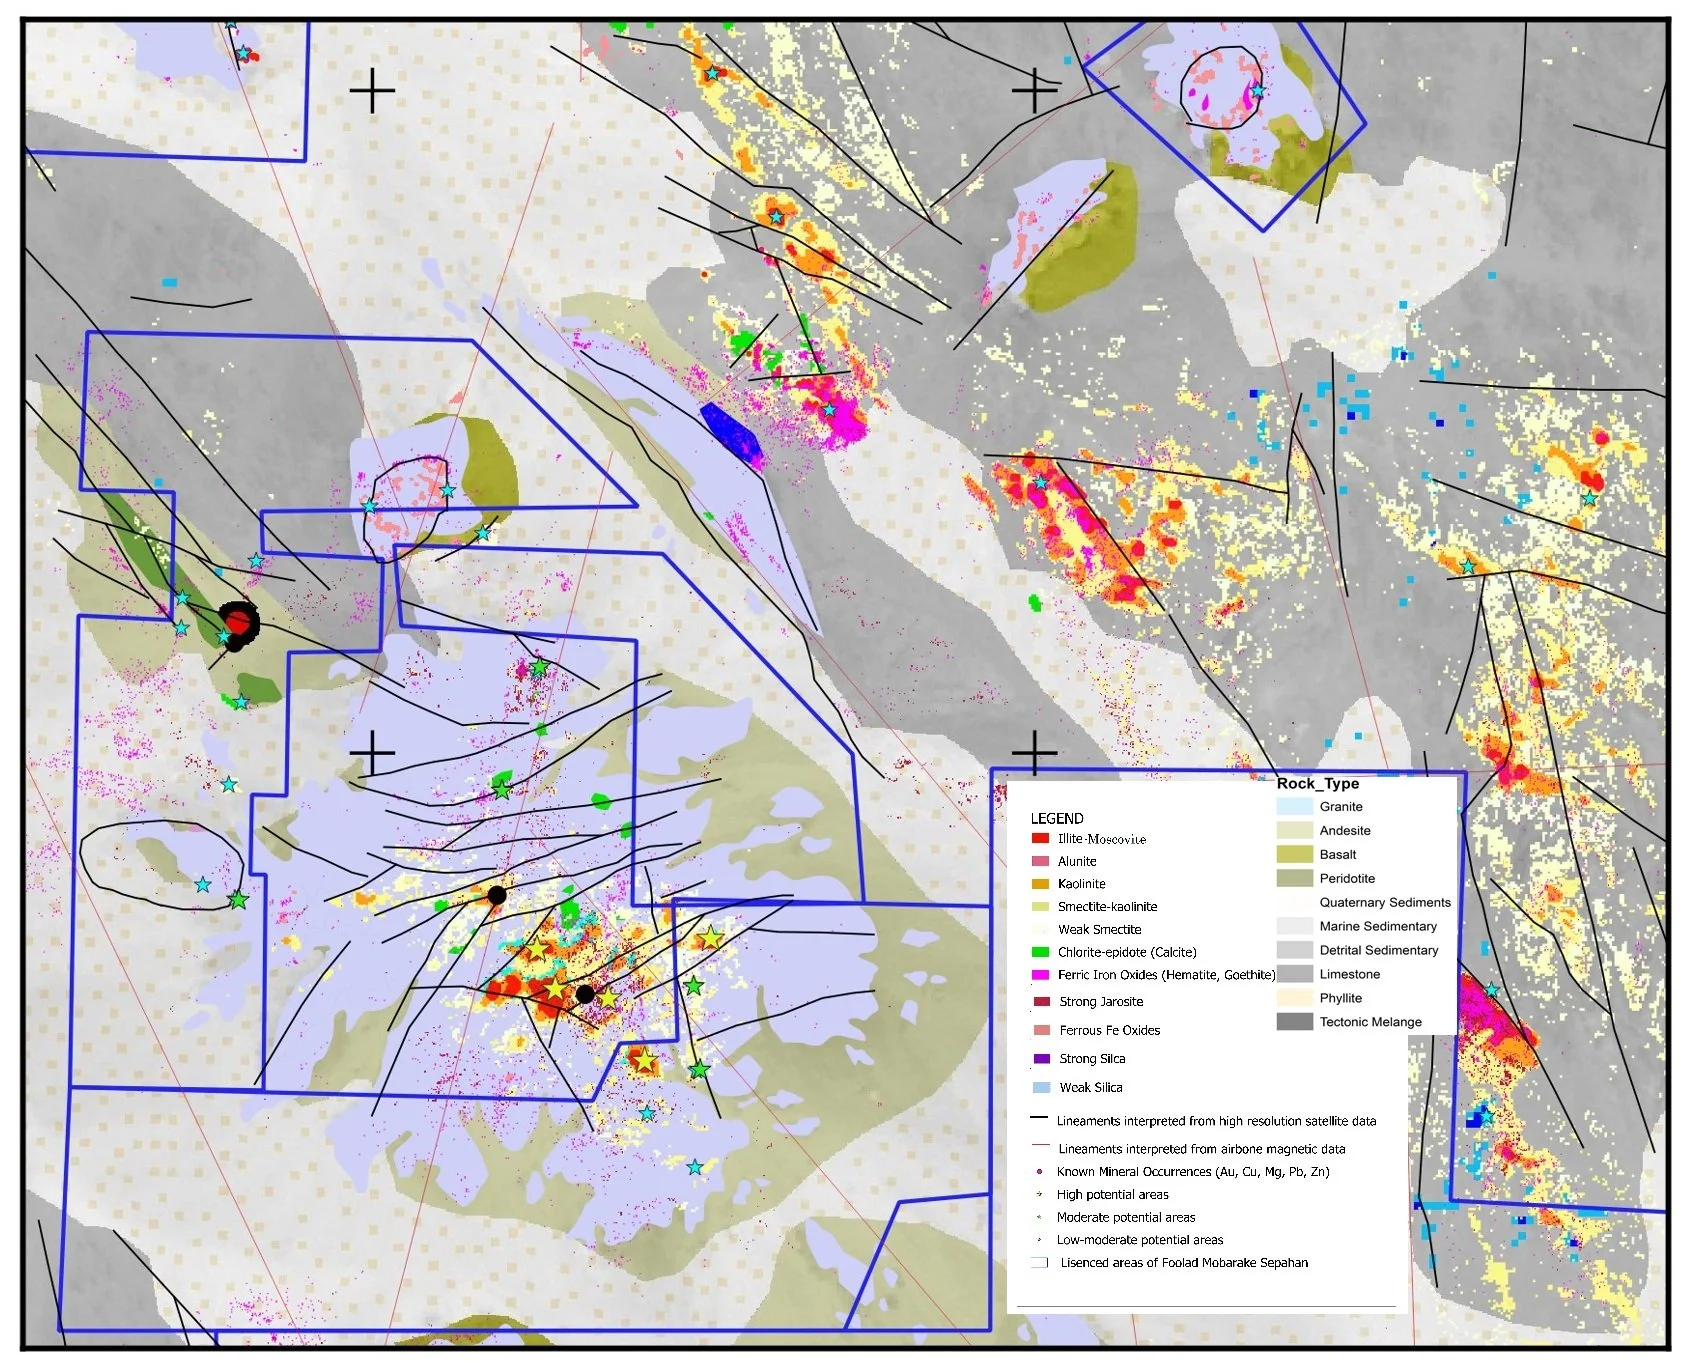
Target Map
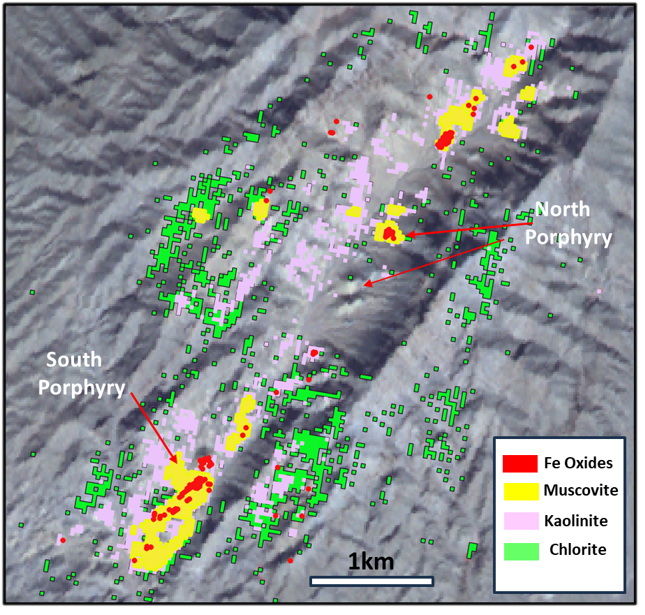
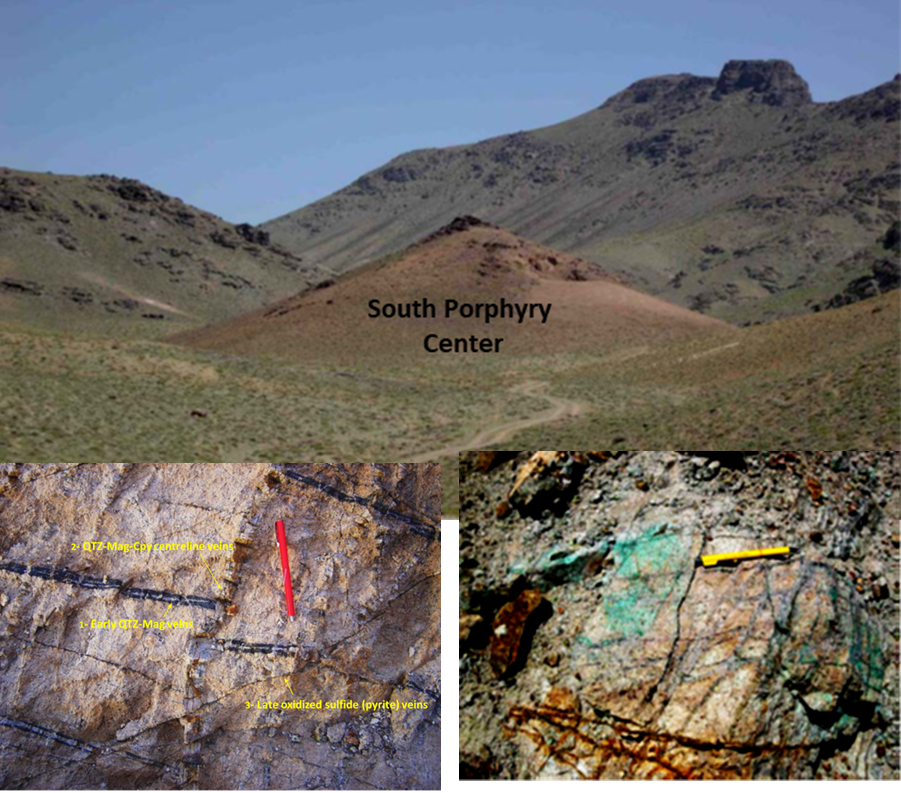
Mapping Hydrothermal Alteration in the Dalli porphyry copper deposit by using PRISMA Hyperspectral and Sentinel 2A Multispectral satellite data on a camp scale
Based on the porphyry Cu-Au mineral systems of the area, remote sensing data, including PRISMA hyperspectral satellite imagery data and multispectral Sentinel-2A data, were processed to map various minerals as indicated in the presented maps. The hydrothermal alteration clearly shows porphyry zonation in this image; phyllic (muscovite) and argillic (kaolinite) alterations associated with ferric iron oxides in the central part, surrounded by propylitic alteration (chlorite/epidote)
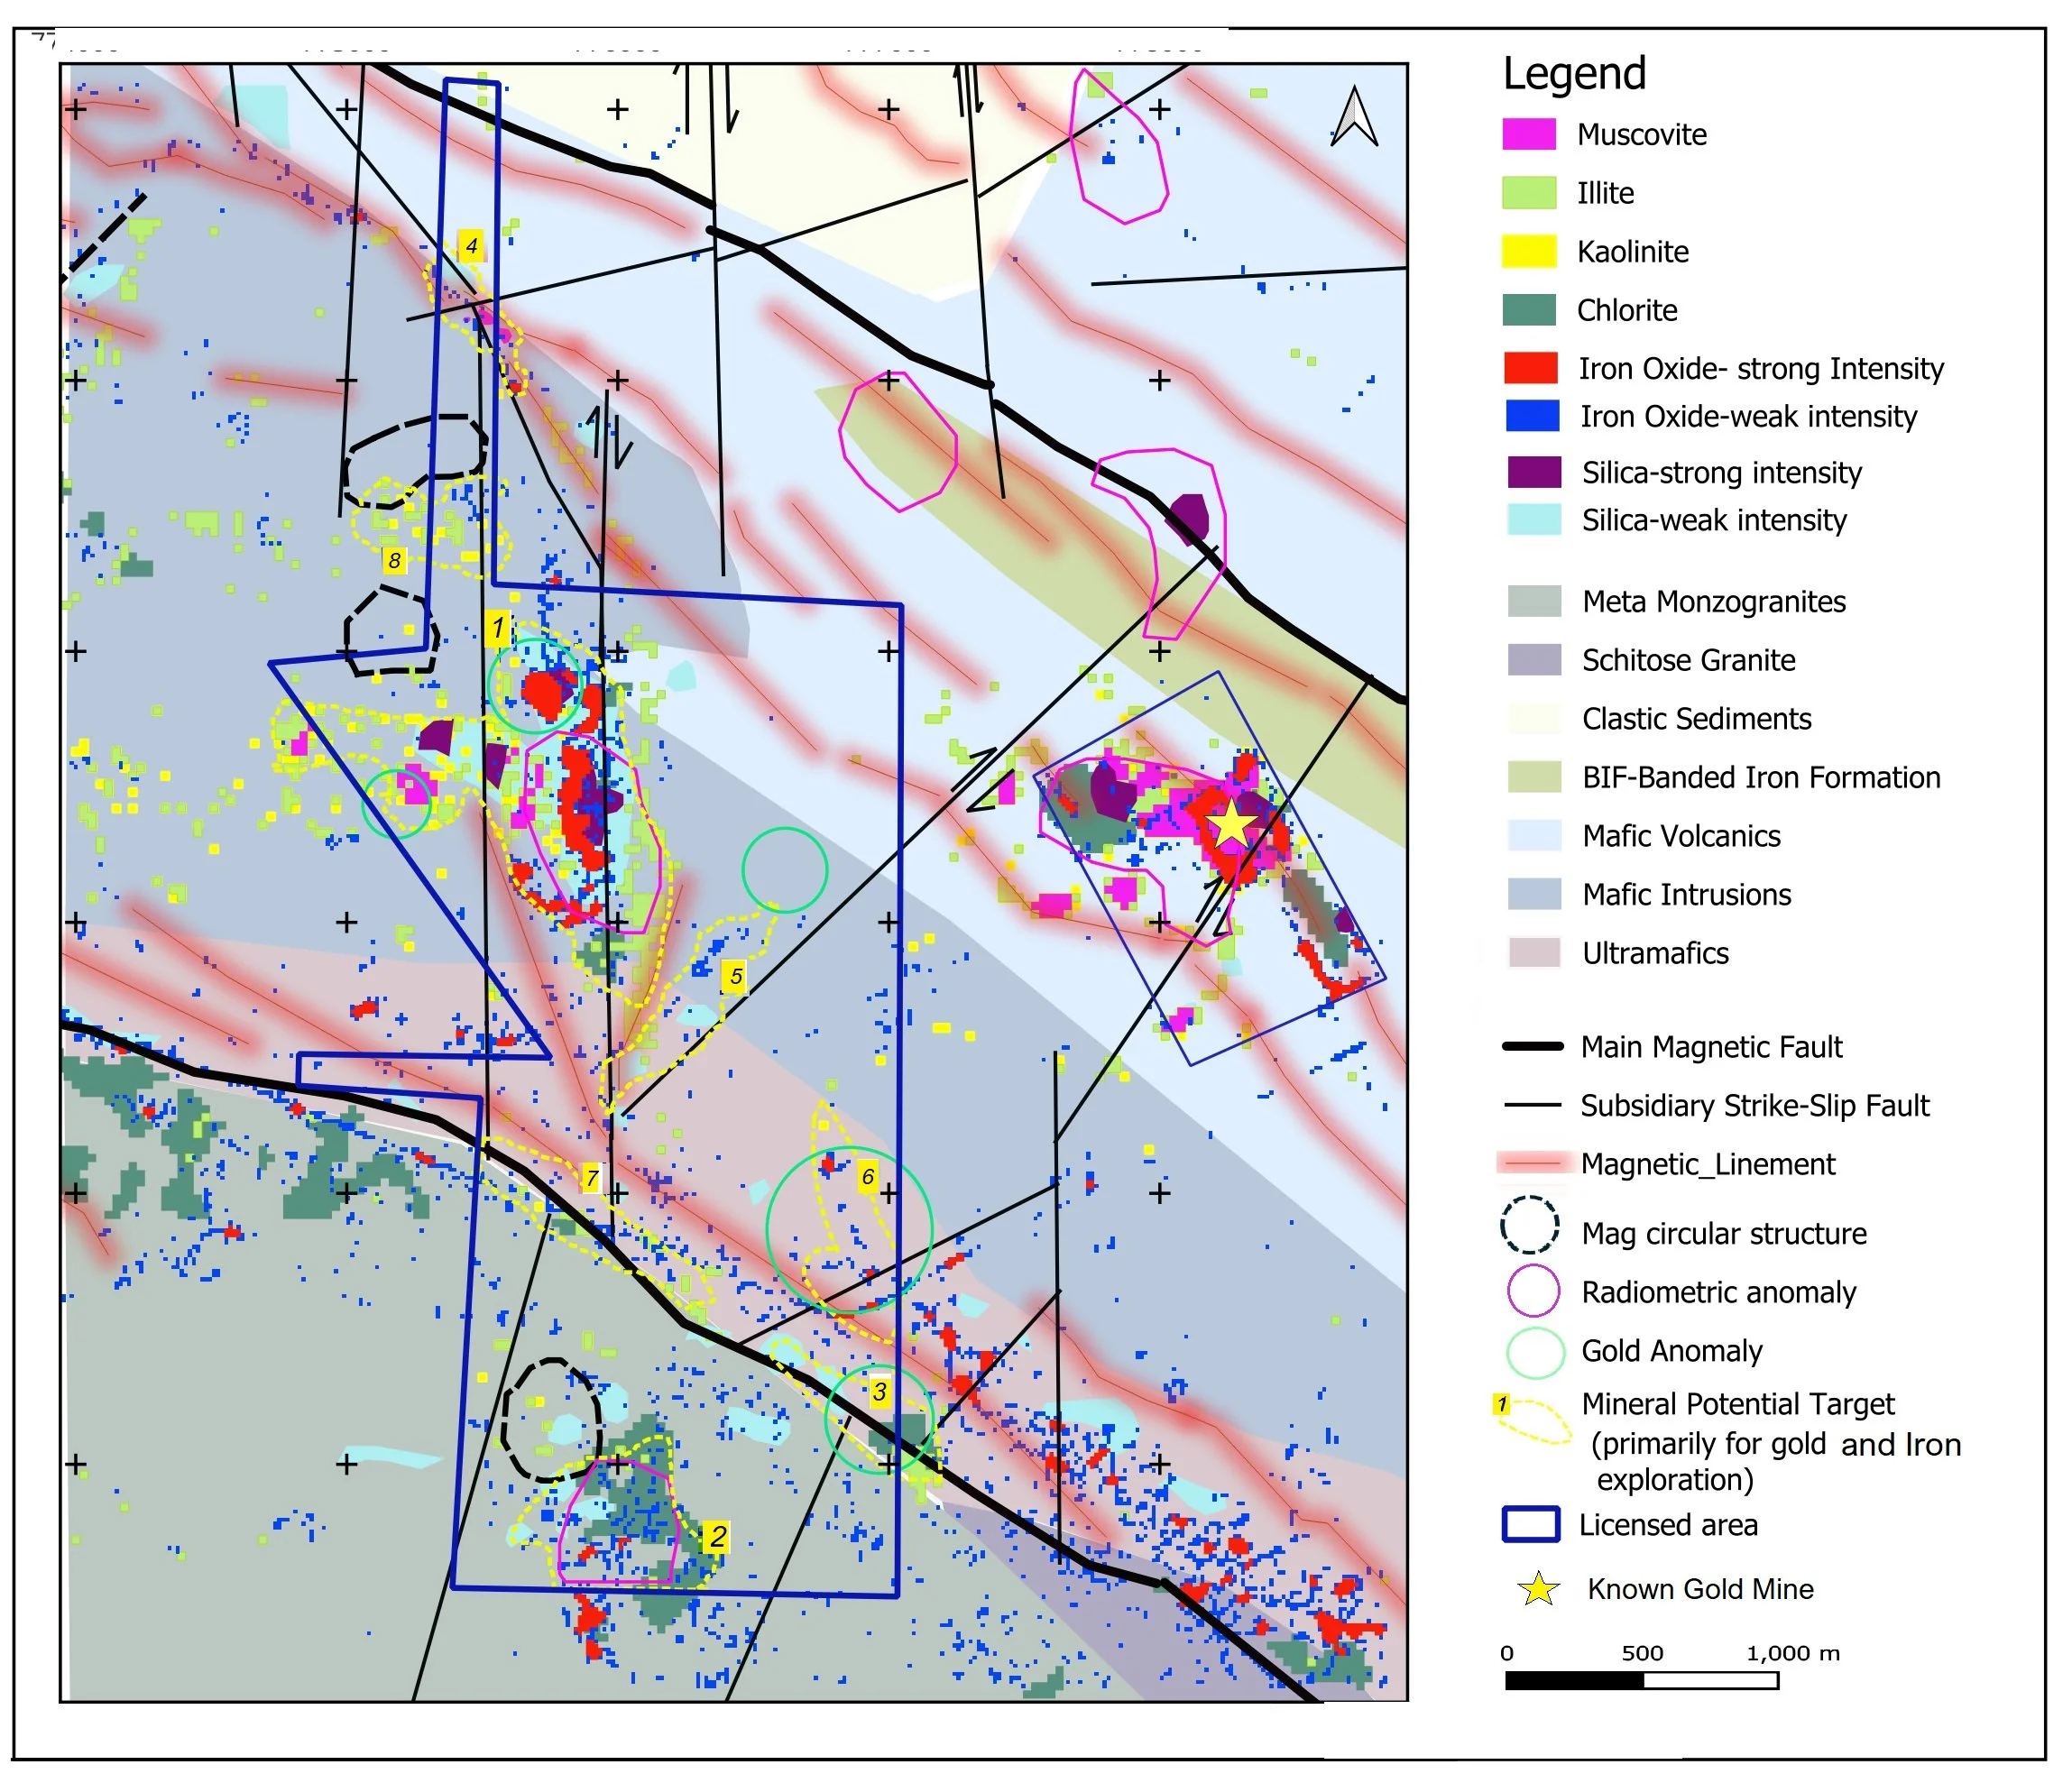
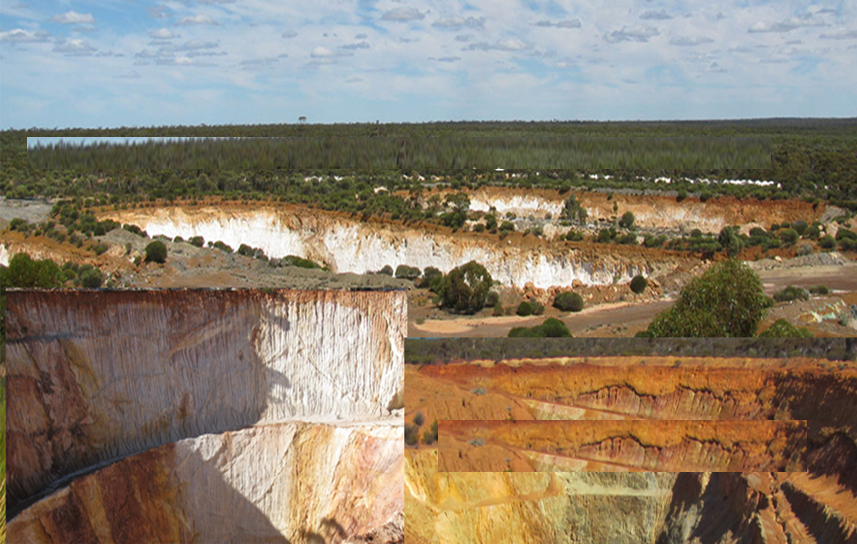
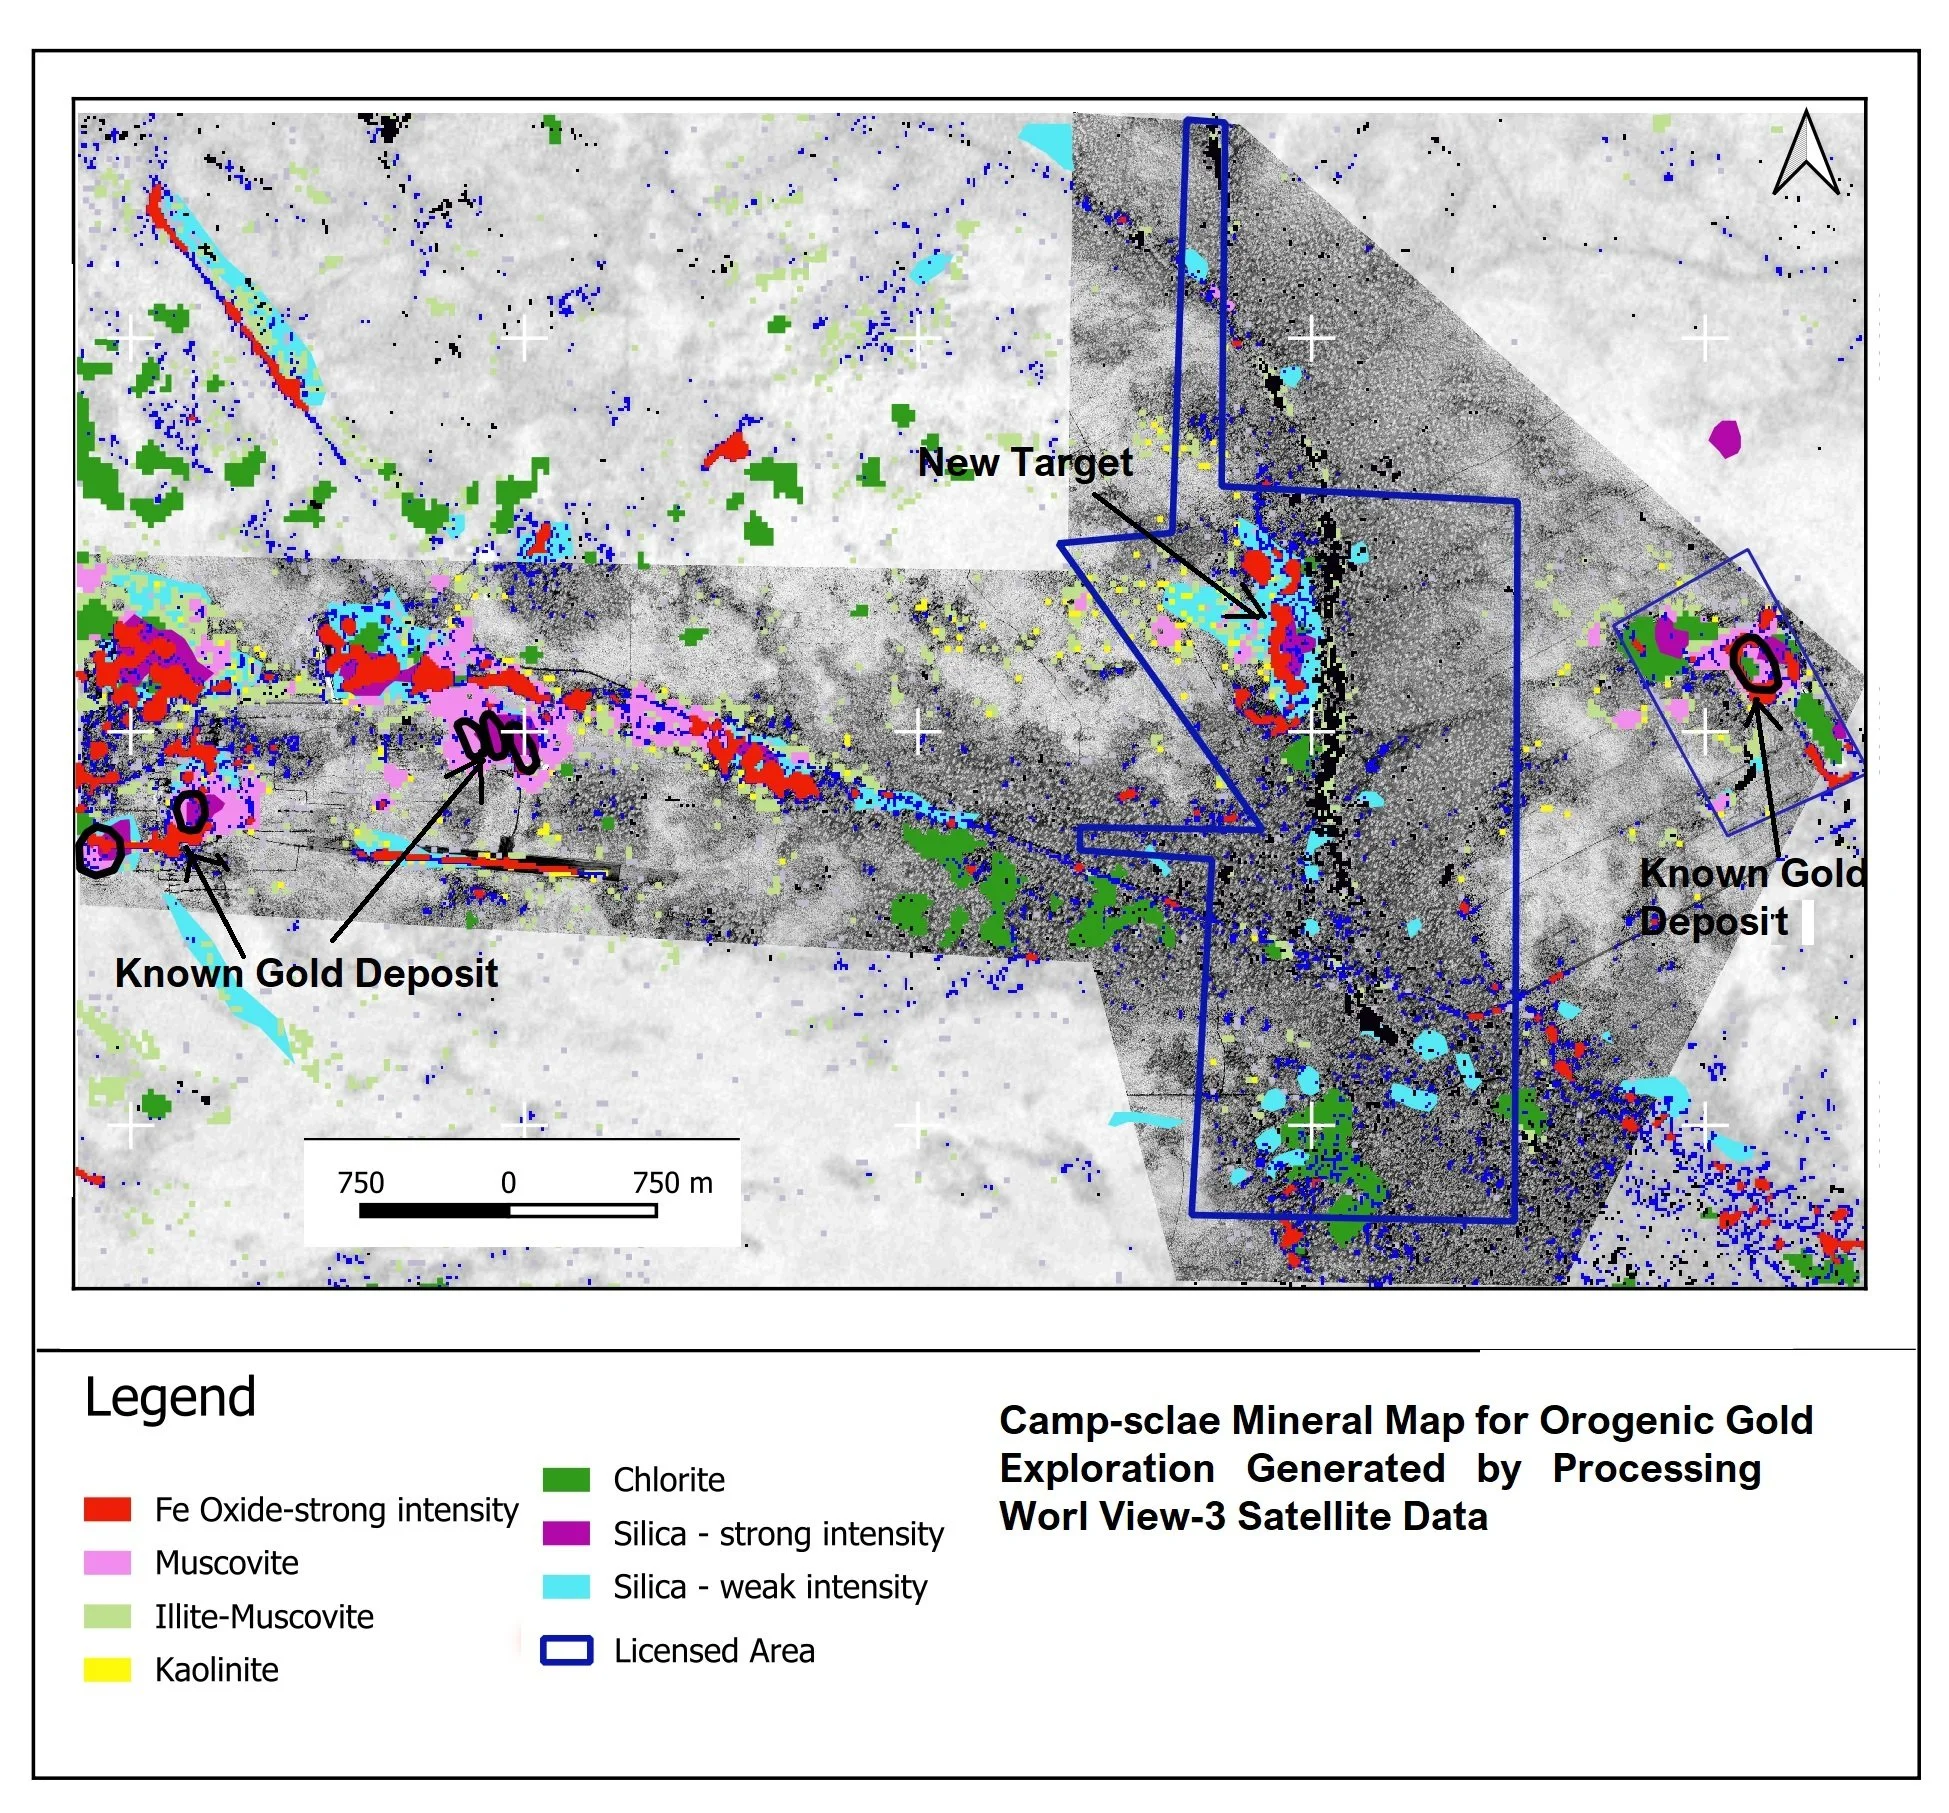
Spectral Analysis of high-resolution Satellite Imagery Data Integrated with Magnetic, Geochemical, and Geological Data for Mapping Orogenic Gold Potential Targets, on a camp scale, Mount Dimer area, Western Australia.
Objective: Identify orogenic gold exploration targets for follow-up field exploration in a small tenement of some 7 square km.
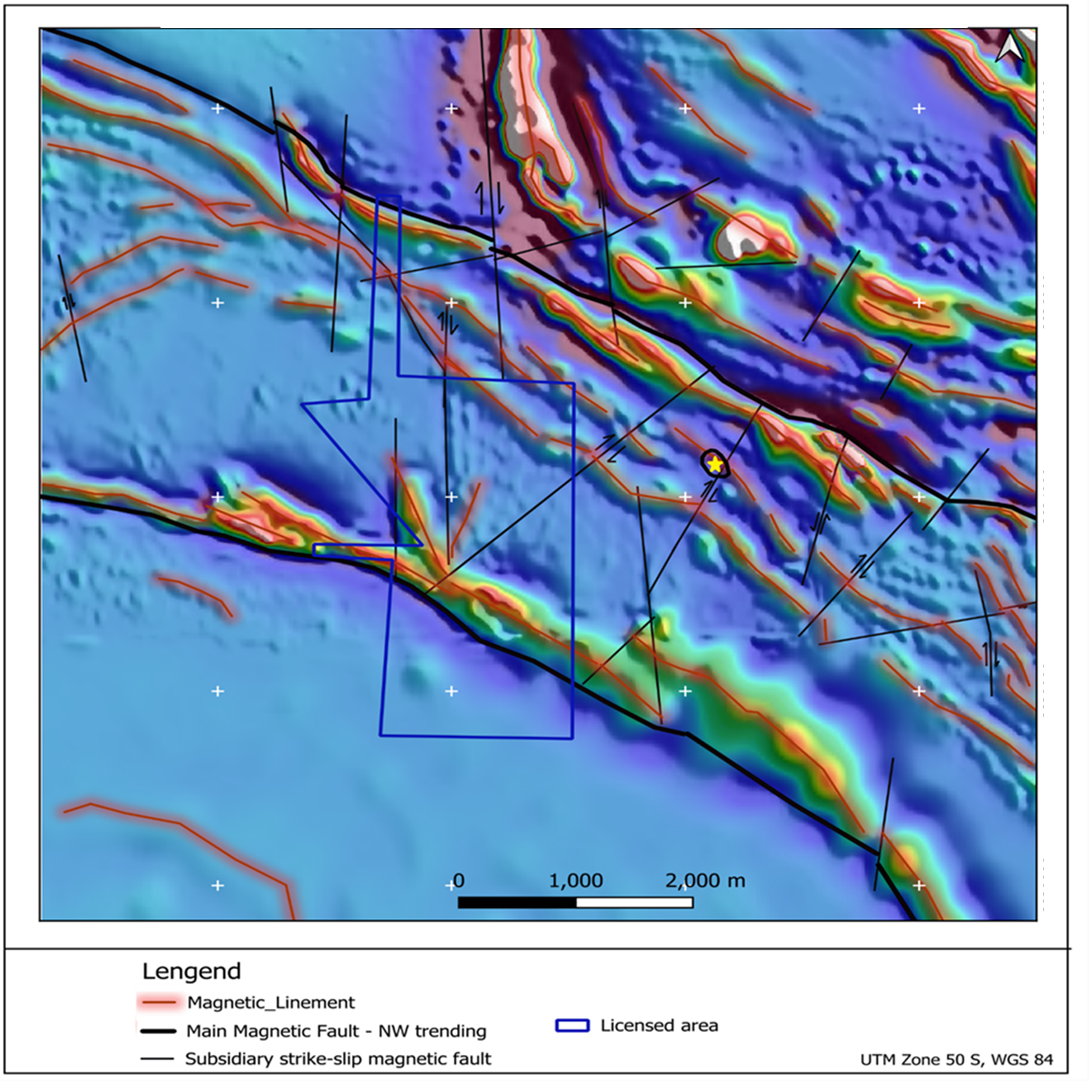
Method: Based on the mineral systems of the area (primarily orogenic gold), multispectral remote sensing data, including WorldView-2 (50 cm spatial resolution), ASTER (30 m revolution), and Sentinel-2A (10 m resolution), as well as hyperspectral satellite imagery data (224 bands), such as EnMap and Prisma, were processed to map various minerals as indicated in the presented map. Airborne magnetic data were used to map linear and circular structures, as well as linear magnetic anomalies. The results were combined with the geological and geochemical maps of the area to identify various exploration signatures similar to those of the two nearby gold Mining areas.
Target Identification: Based on key orogenic gold & BIF mineralization indicators, several targets were mapped within the project area for follow-up ground exploration.Indicator gold exploration signatures from spectral remote sensing, magnetic, geochemical, and geological data were extracted and integrated to highlight eight priority areas for follow-up field exploration. The deliverable data included favorable RGB images, three intensity maps of clay, iron oxides, and silica, as well as a mineral map, a structural map, and a final target map, along with their corresponding shape and geo-tiff files.
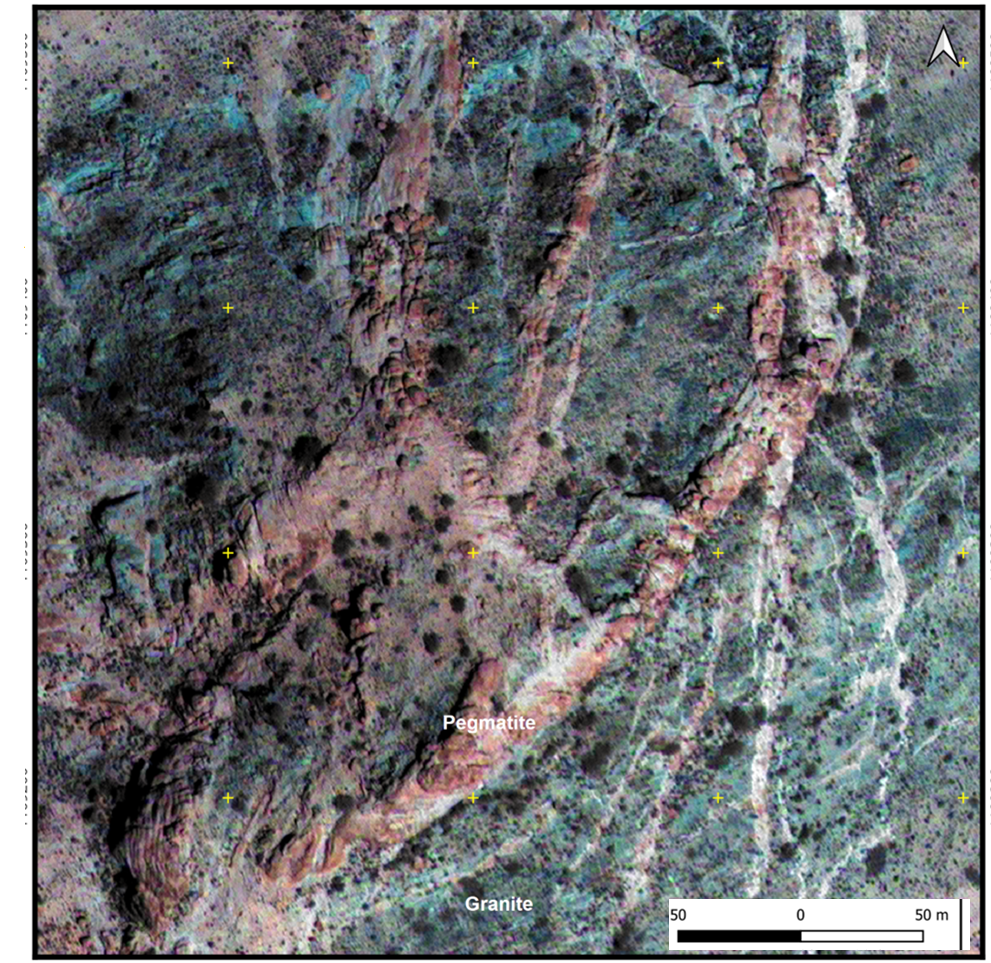
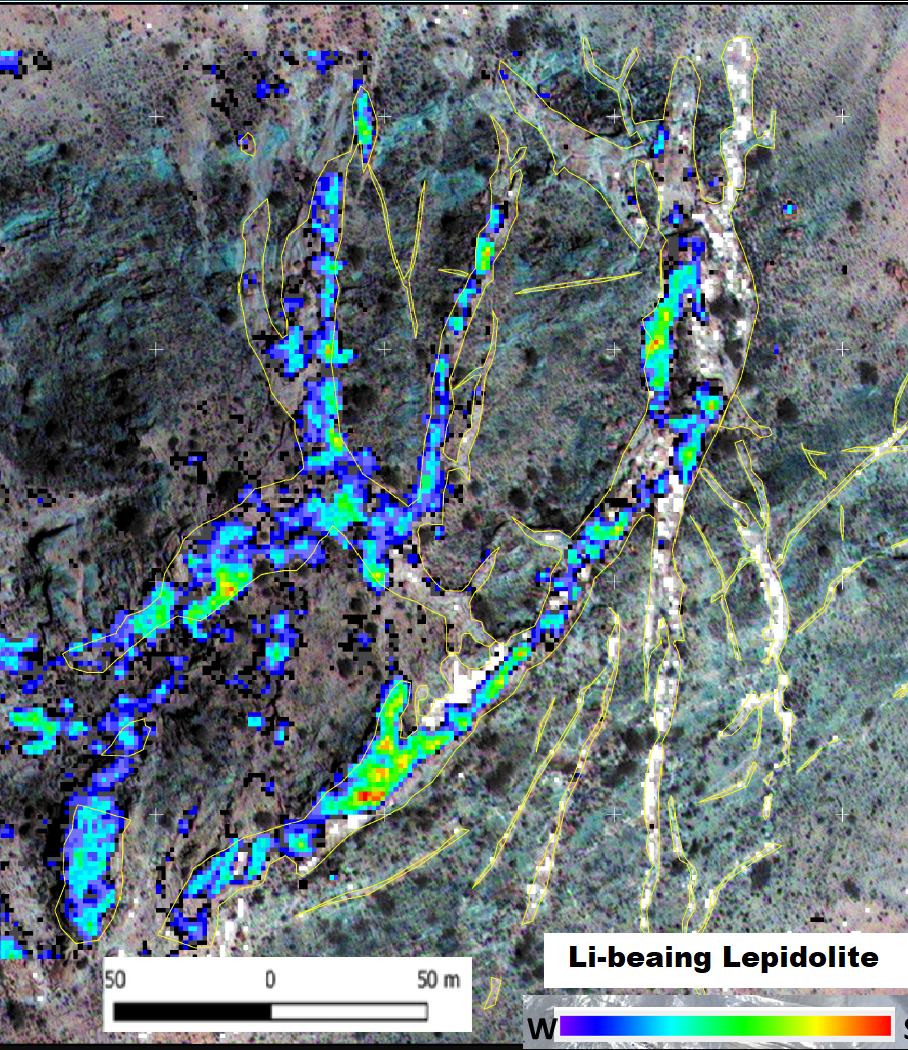
Spectral Analysis of High-Resolution satellite data (Worldview- 3) for lithium-bearing pegmatite exploration in a camp scale, NW Somalia (three projects)
Objective: Identify camp-scale lithium exploration targets in pegmatites for follow-up field exploration in a small tenement (~30 square km).
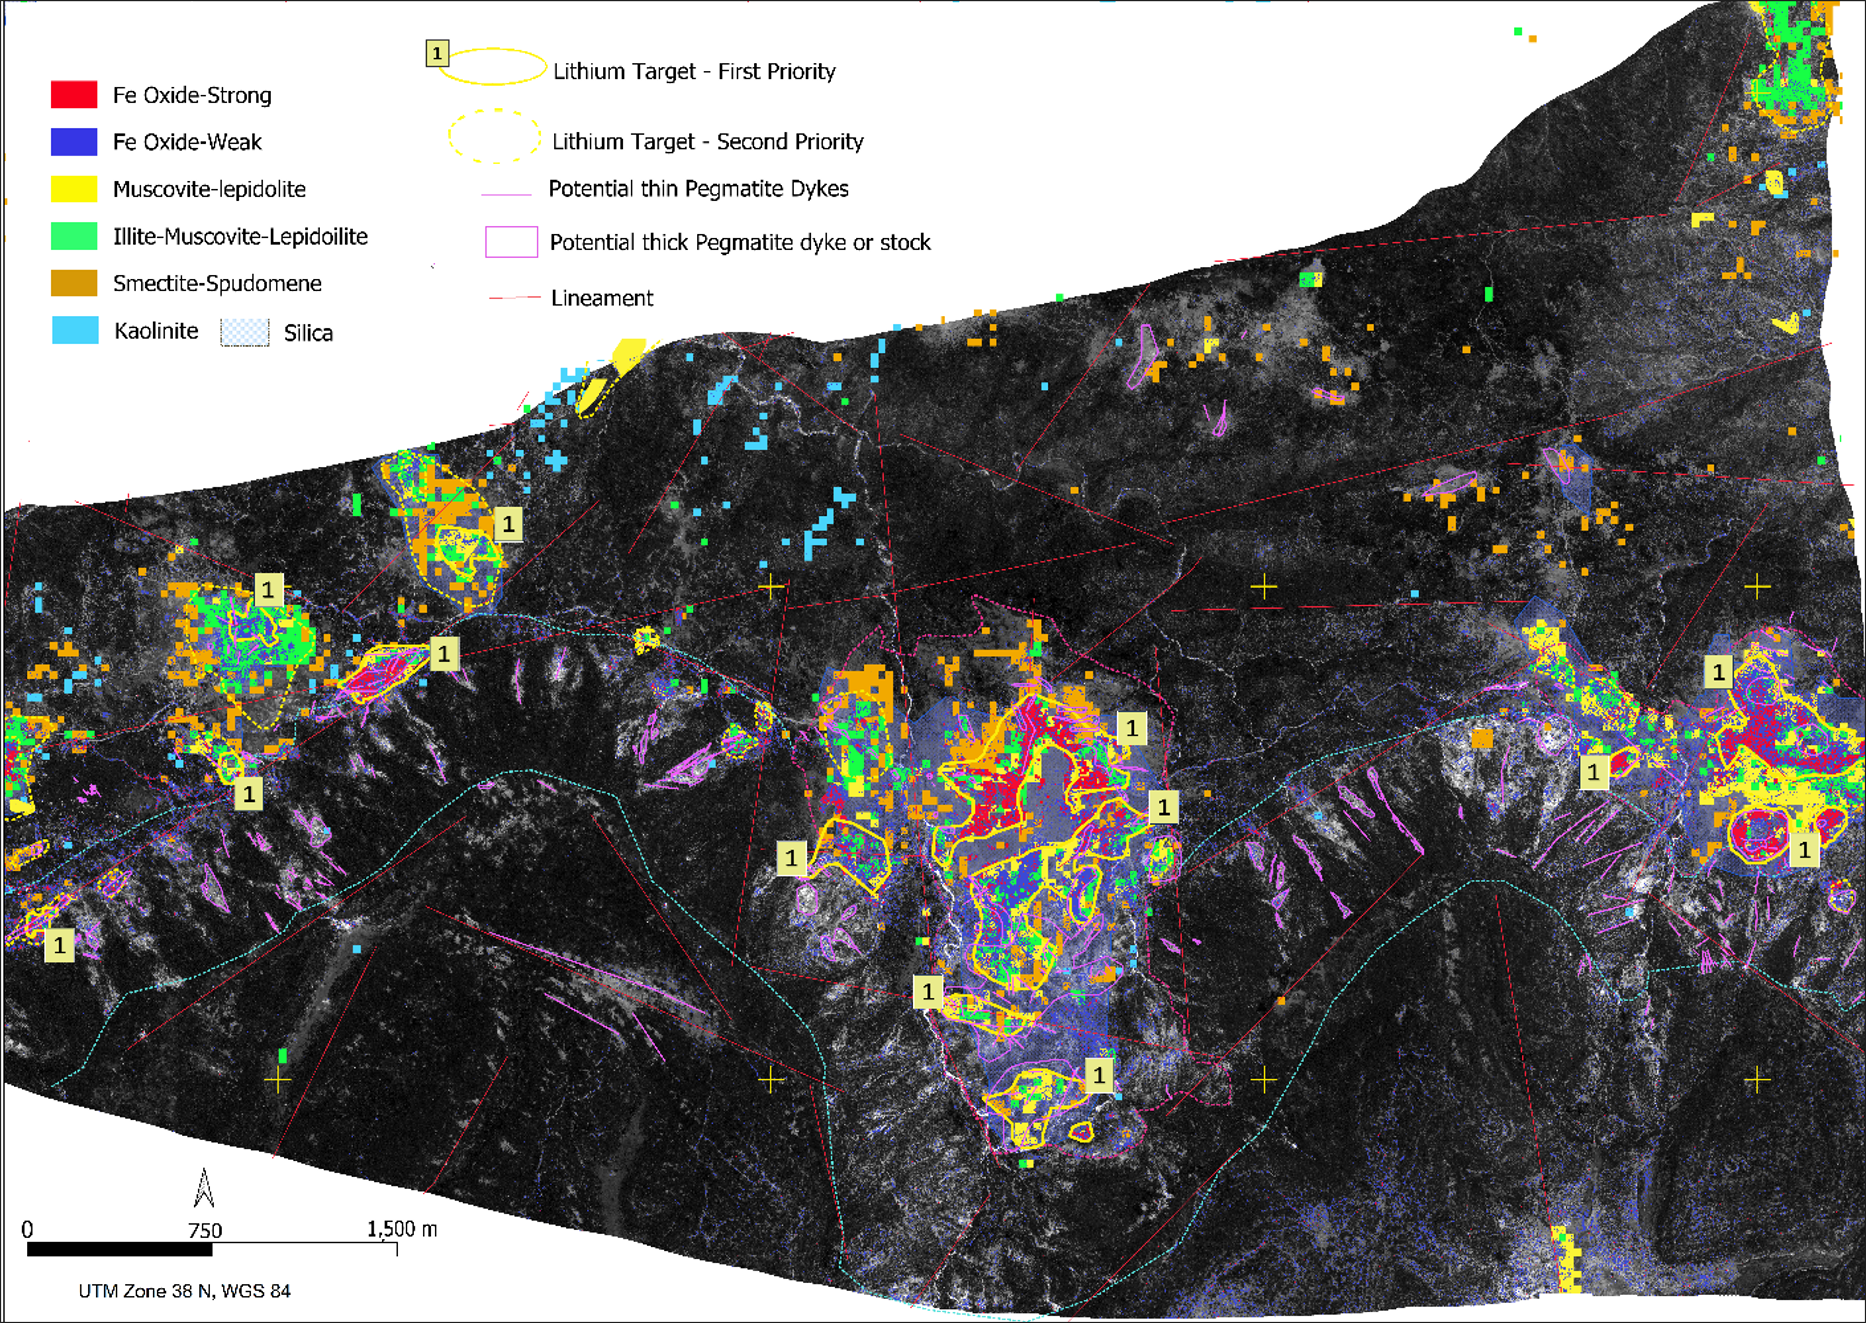
Method: Based on the area’s mineral systems, high-resolution multispectral WorldView-3 data were processed to map Li-bearing minerals and pegmatite dykes, as shown in the presented images.
Structural Controls: Pegmatite lithium exploration is influenced by structural controls, particularly along fold hinges and axial planes in the central region, where tectonic stress conditions favour the emplacement of Li-bearing pegmatite dykes and stocks.
Target Identification: Key indicator minerals (such as lepidolite, spodumene, muscovite, illite, smectite, kaolinite, iron oxides, and silica) were identified through high-resolution spectral analysis and combined with other mapped indicator features, including lineaments and pegmatite dykes/stocks, and folding features to define exploration targets. Lithium mineral indicators, mapped through WV3 satellite imagery, were integrated with pegmatite dykes/stocks and lineaments. This integration helped identify high-potential areas for future lithium exploration. Based on correlations among mineralisation indicators, several lithium targets were classified into first- and second-priority areas for further exploration. The results highlight a strong potential for lithium pegmatite mineralisation, particularly in the central part of the area, where pegmatite stocks and dykes intruded into a metamorphosed unit at the hinge of the folding.
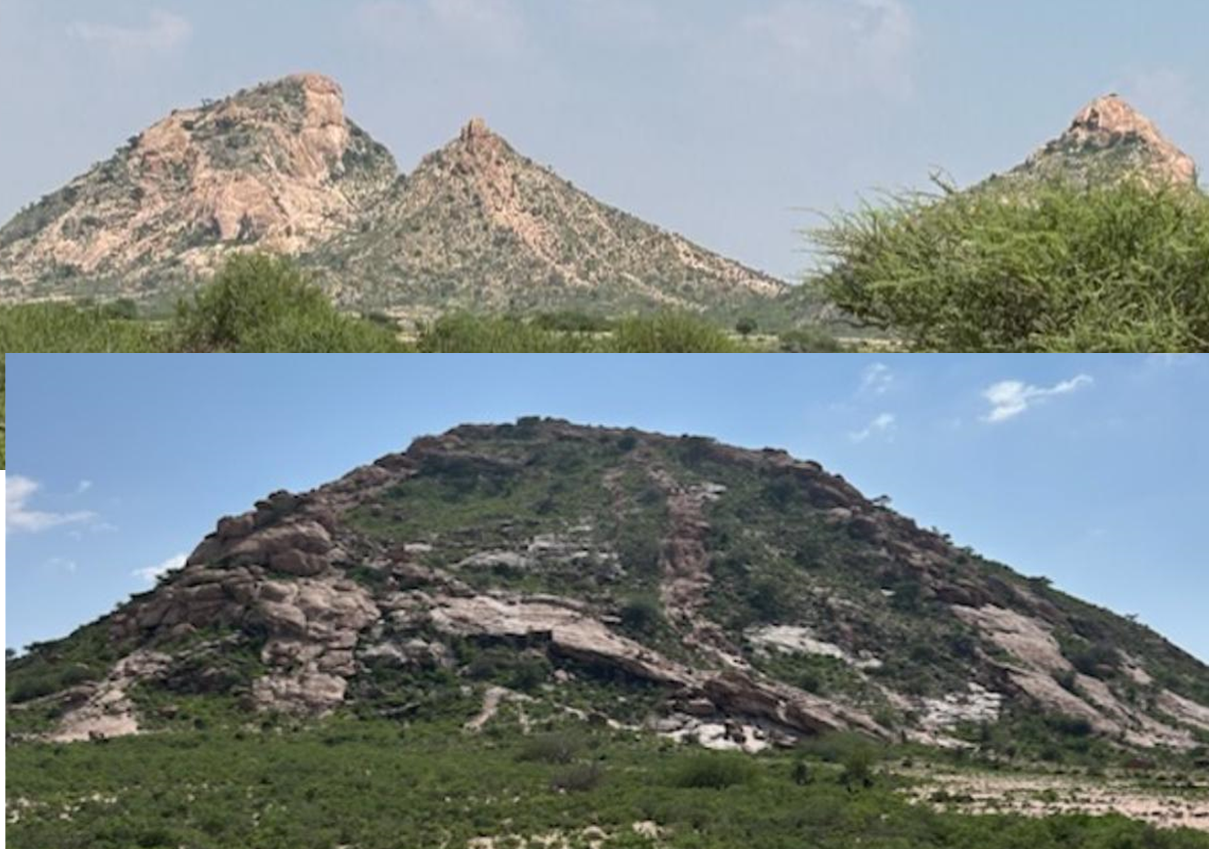
First-priority targets, primarily located in the central region, exhibit strong lithium indicators and are recommended for immediate follow-up. Second-priority targets are less defined but still warrant further investigation. The remotely sensed and field pegmatite dykes, as well as Li-bearing targets (e.g. Li-bearing lepidolite mineral), are shown in the presented images.

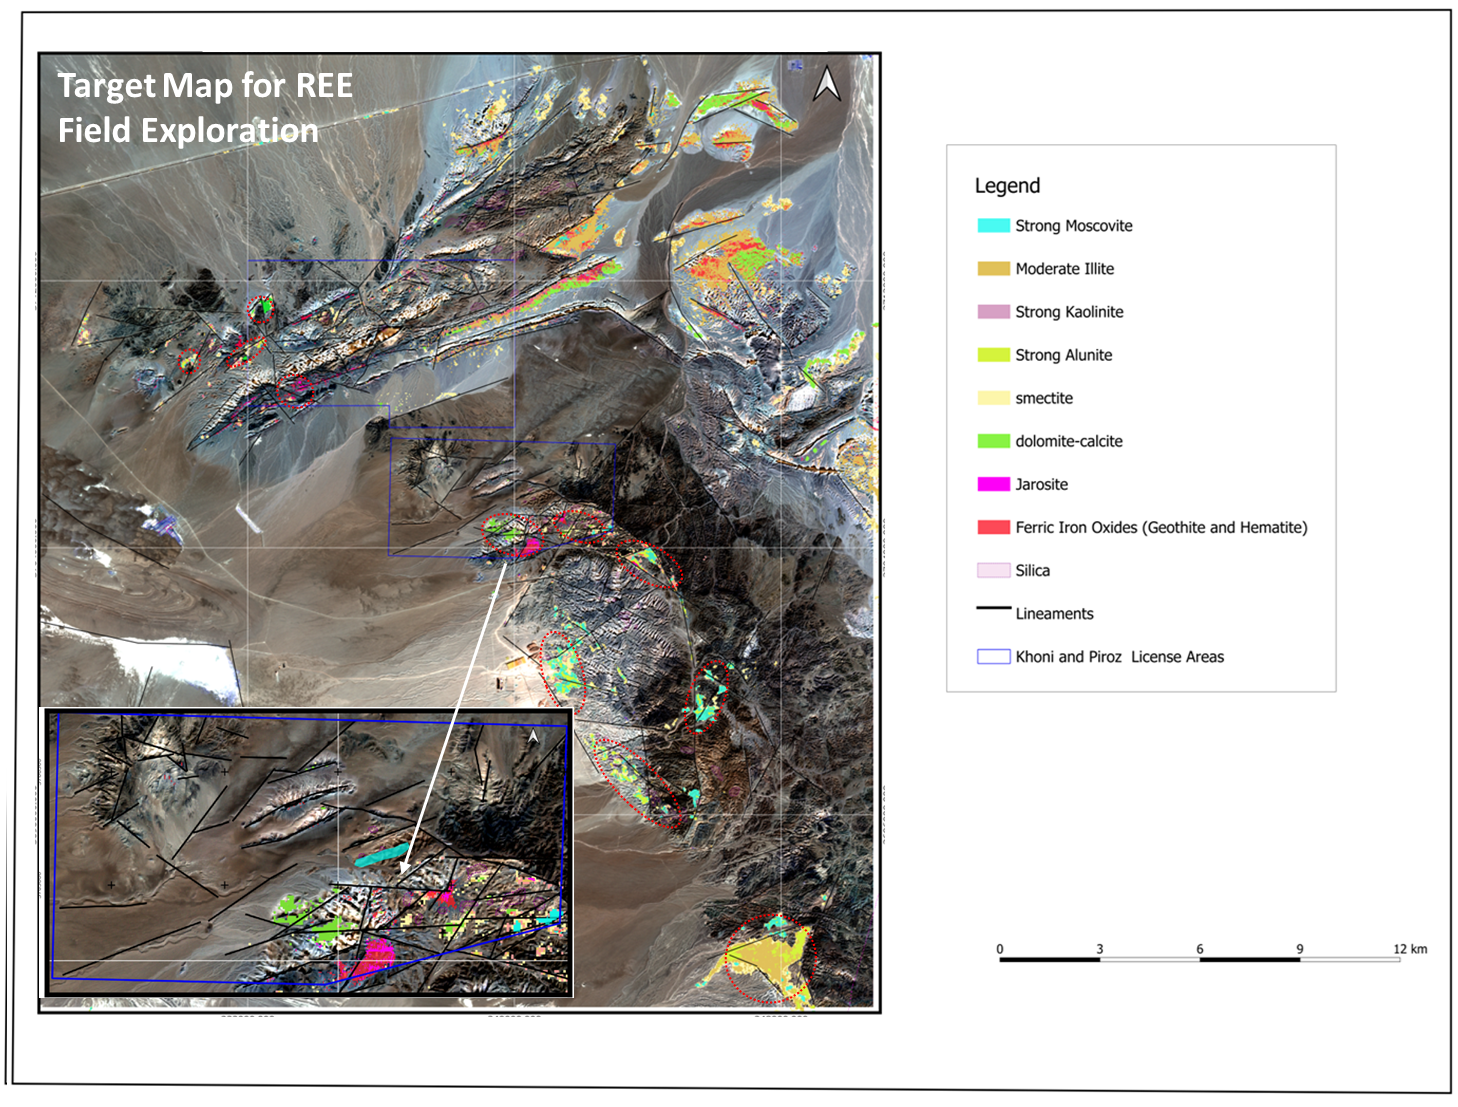
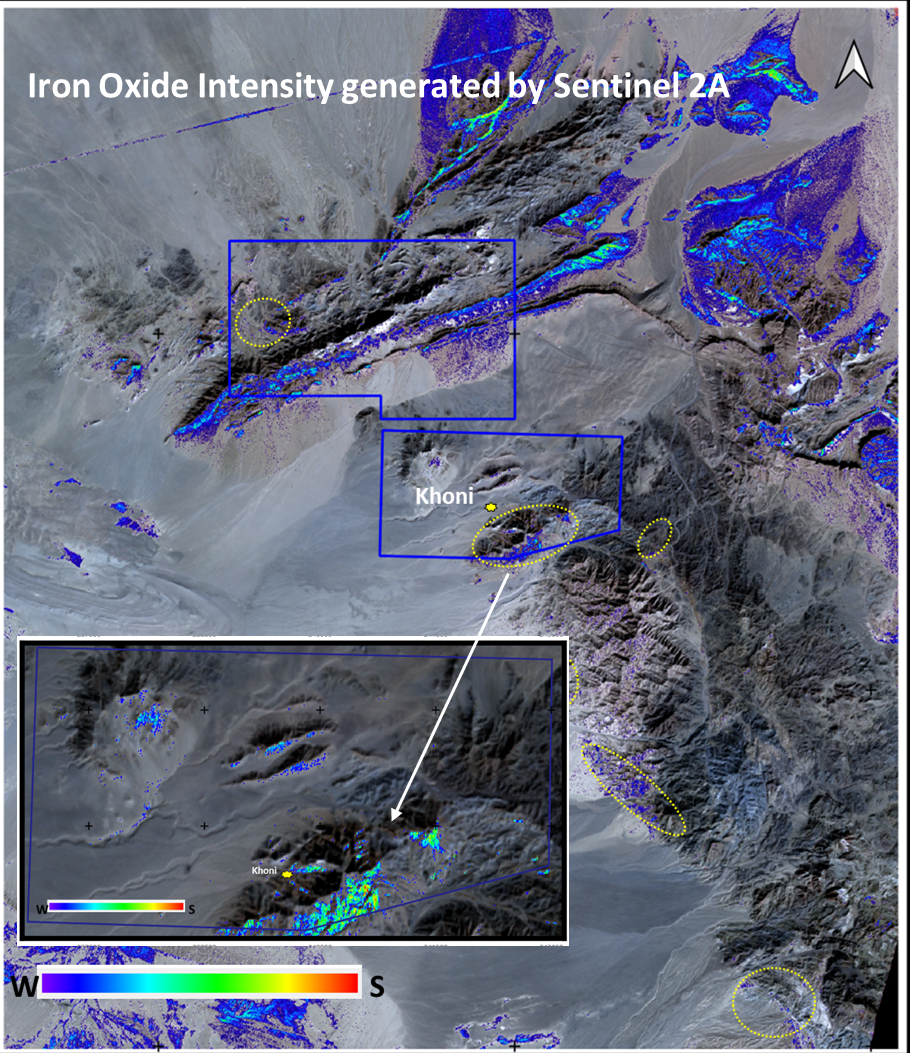
Mineral Spectral Analysis of Aster, Sentinel 2A and Prisma Satellite Imagery data for mapping REE mineral potential areas, Saudi Arabia
Method: Based on the mineral systems of the area, multi- and hyperspectral satellite data were processed to map regions of REE mineral potential associated with carbonatites, clay hydrothermal alterations and iron oxides.
Target Identification: Key indicator minerals such as carbonates, muscovite, illite, smectite, kaolinite, iron oxides, and silica were identified through spectral analysis and combined with other mapped indicator features, including lineaments.
Zones of substantial argillaceous clay alterations (kaolinite, illite, smectite), phyllic alteration (muscovite) and carbonates associated with iron oxides and lineaments could be important targets for field follow-up exploration of REE mineralization.
The areas showing the assembled REE mineral indicators and lineaments, primarily located in the central part of the area, are recommended for immediate follow-up.
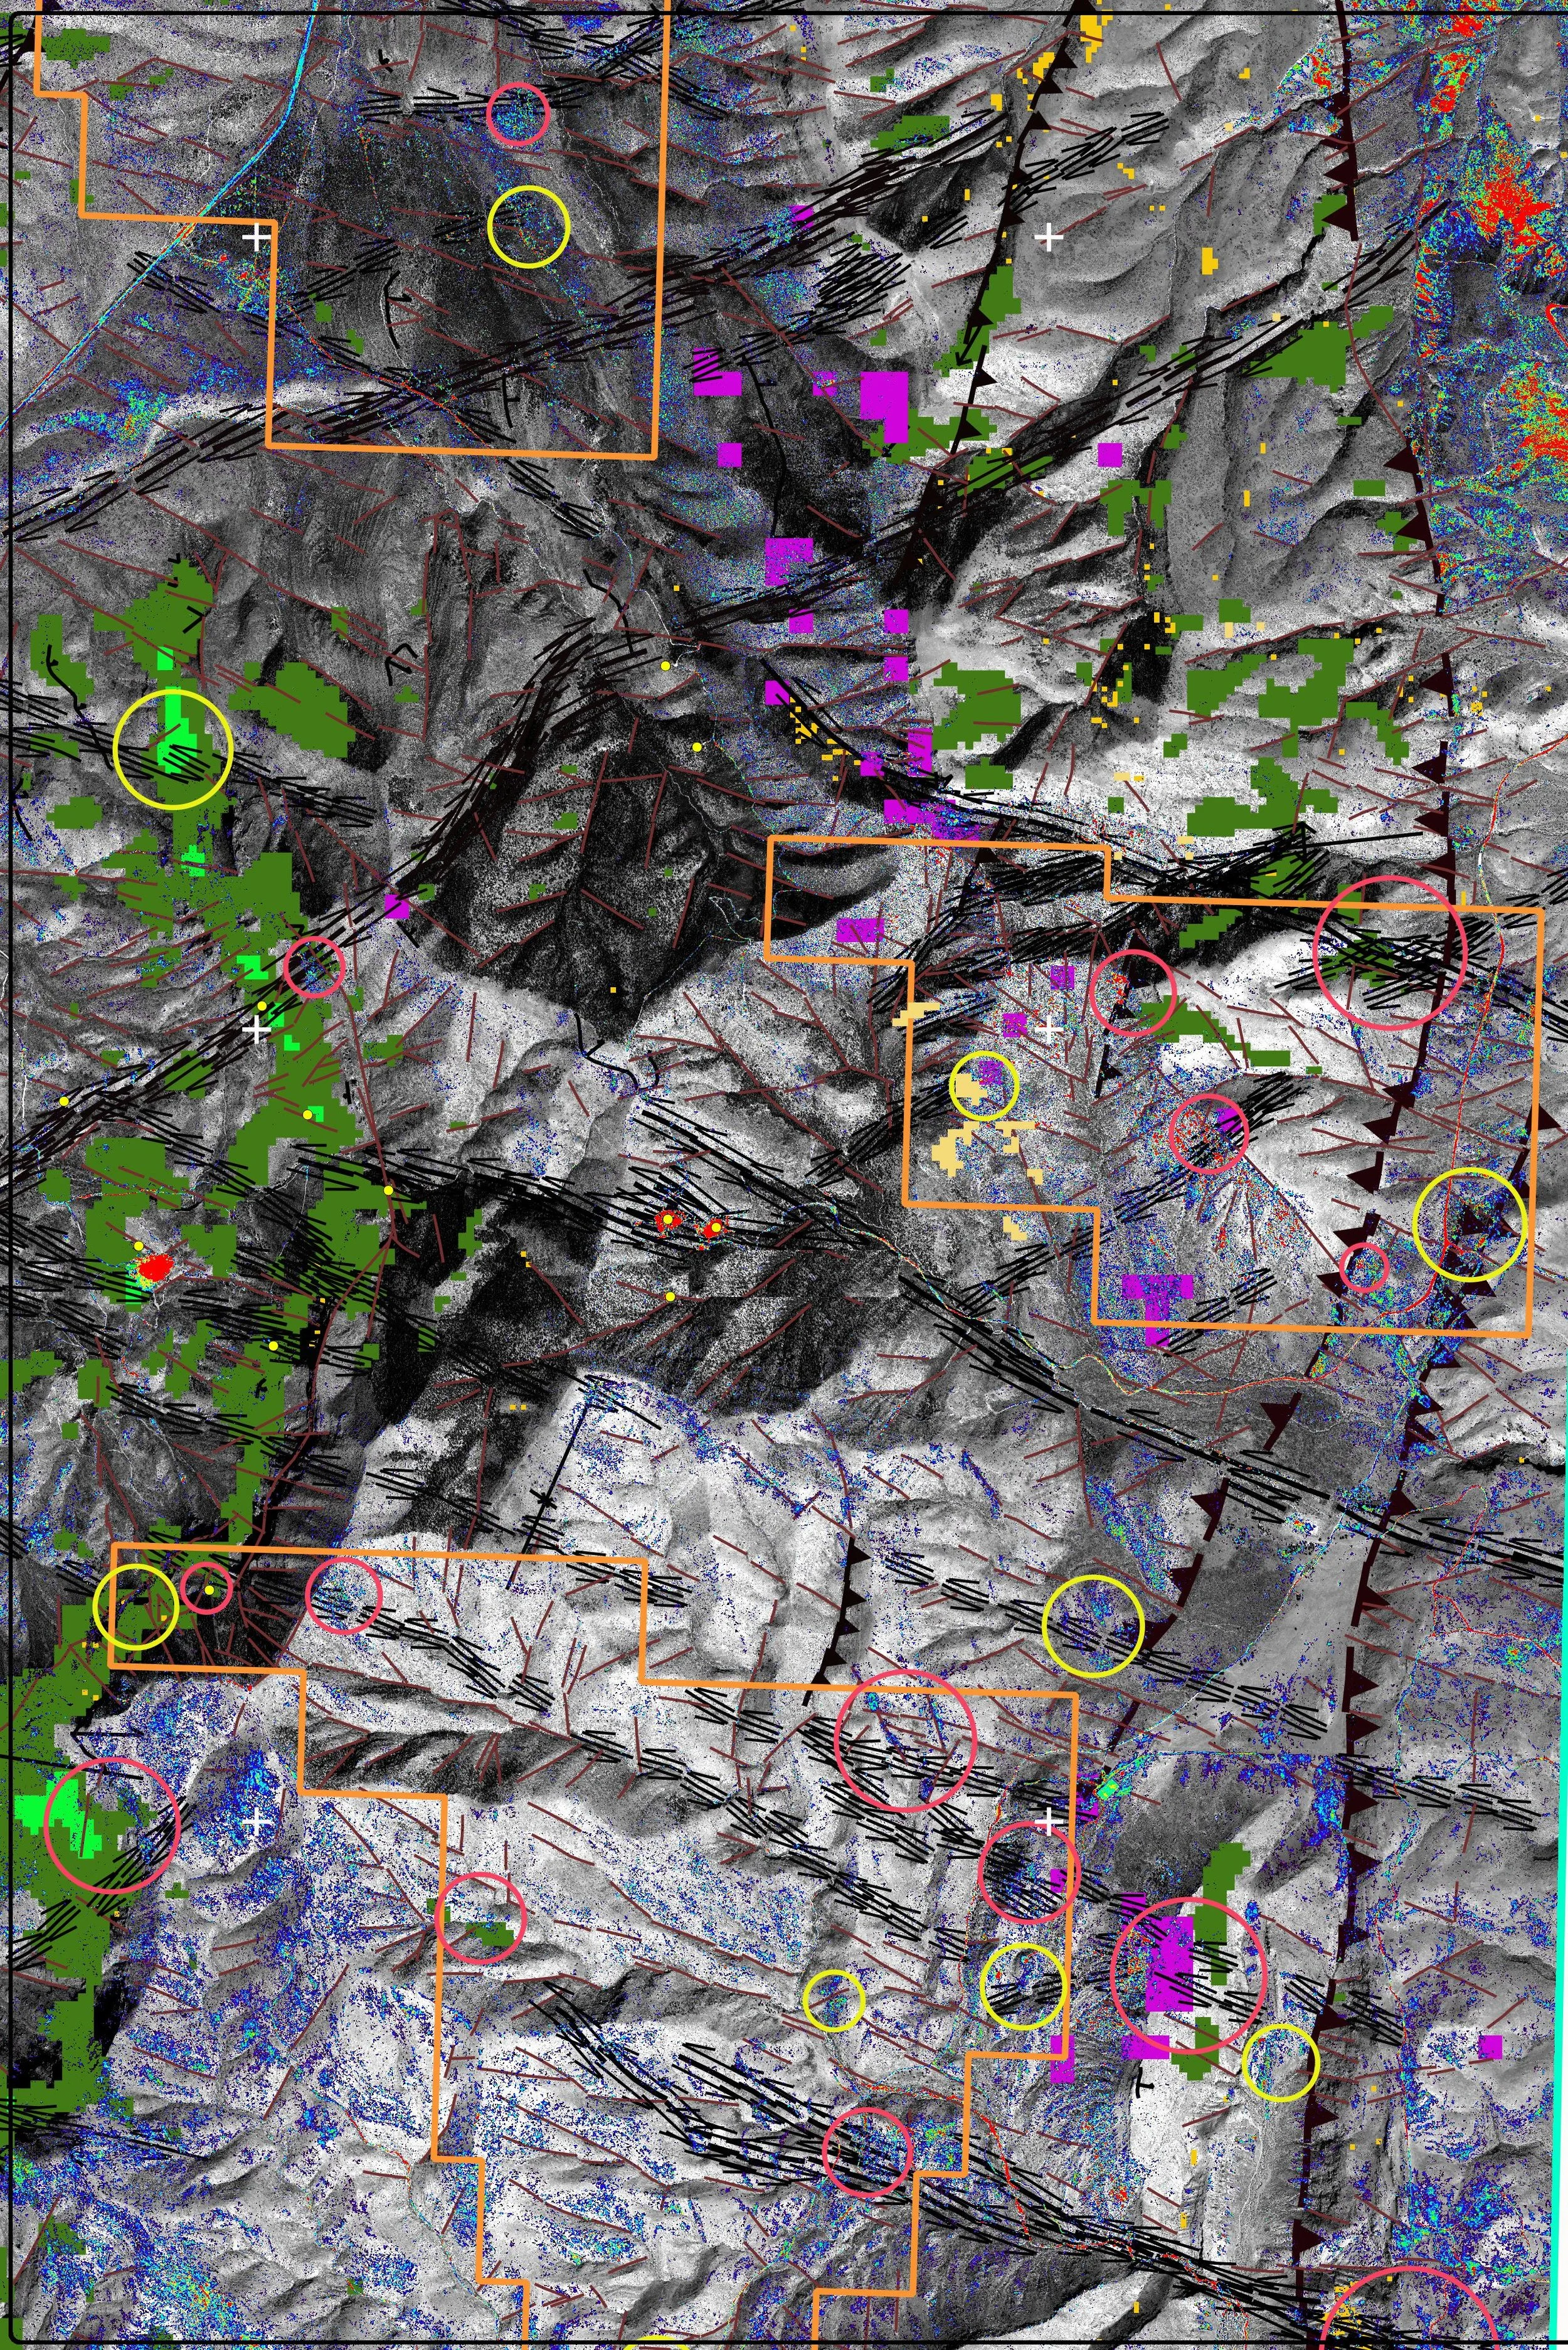
Minral Mapping and Structural Analysis of Worldview-3 Imagery in Targeting Gallium-Germanium Mineralization associated with Mississippi Vallly Type (MVT) systems
LEGEND
Targets
First Priority Target
Second Priority Target
Mineralization / Alteration
Fe Oxides-Strong
Fe Oxides-Weak
Calcite (dolomite)-Strong
Calcite (dolomite)-Weak
Silica
Fault zones
major strike-slip dextral
major strike-slip sinistral
major thrust
strike-slip dextral
strike-slip sinistral
thrust
Unclassified Fault/Lineament
Historic Mines
Historic Mines-MVT Mineralization (Ga-Ge byproducts)
Structural Features
Anticline
Syncline
Scale
1,000 m
0
1,000 m
Map Coordinate
4104000