
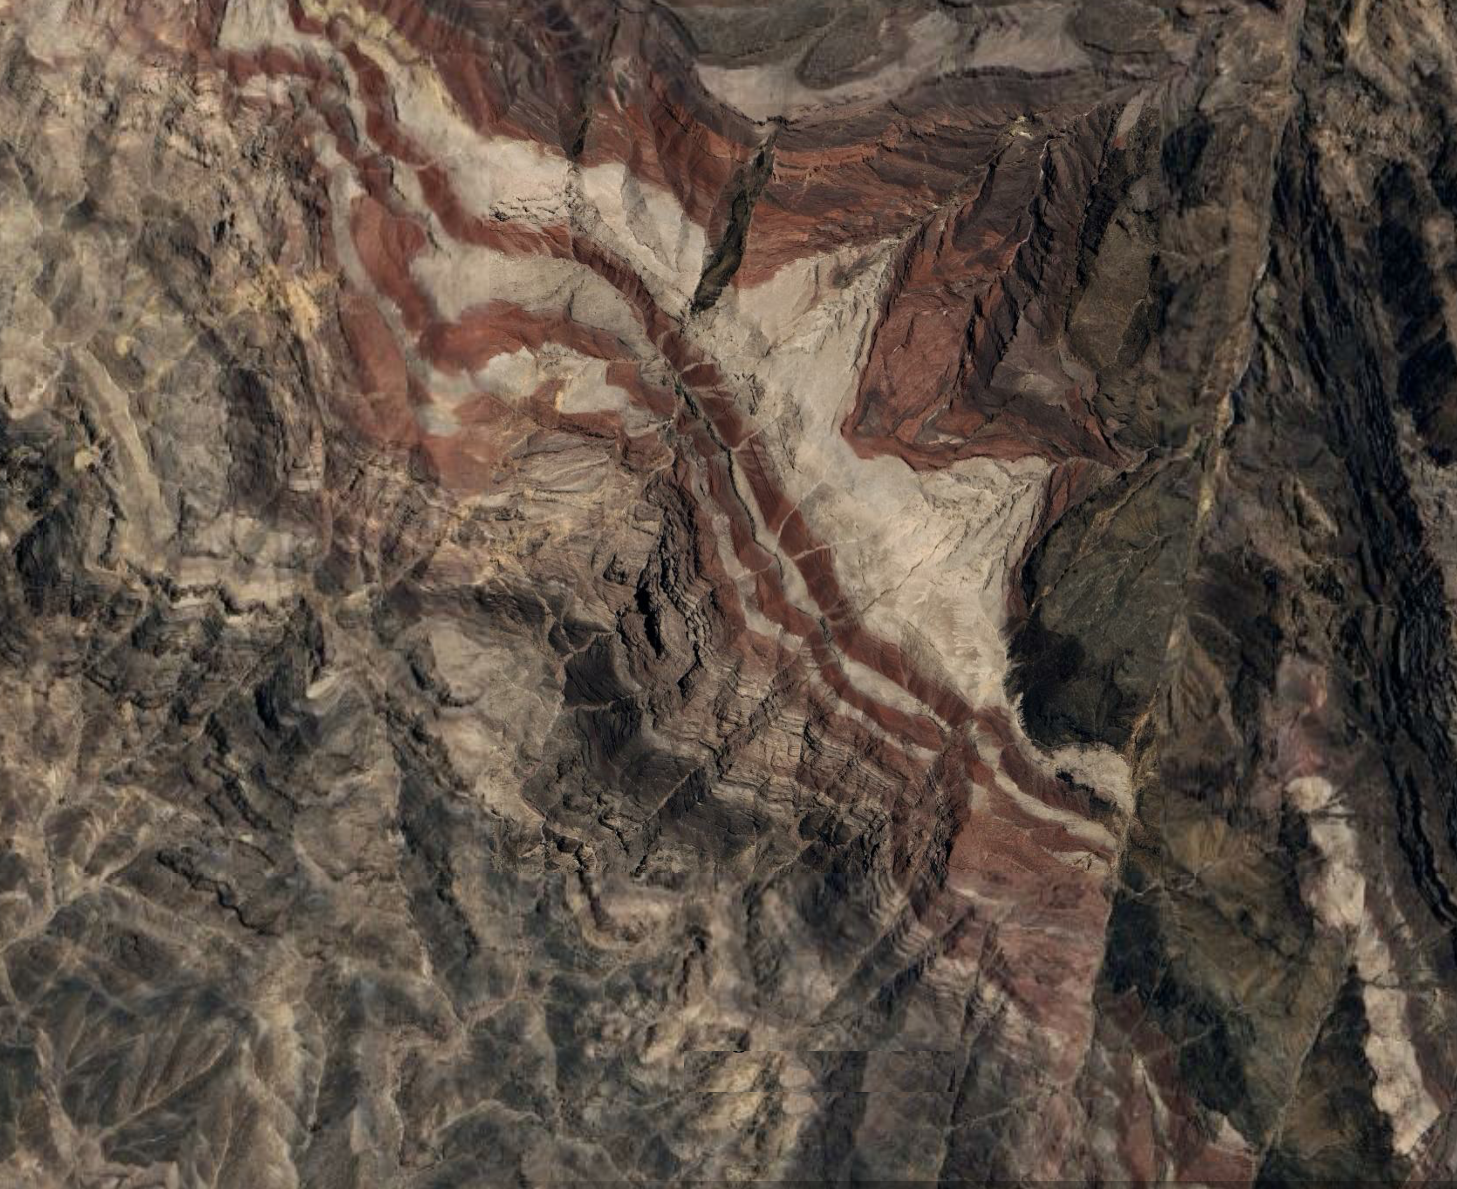
Structural Analysis and Geological Mapping
GeoSpectra process high-resolution satellite imagery to delineate structures and lithological boundaries at regional to prospect scales. By integrating structural/lithological interpretation with other exploration data, we identify key geological controls on mineralisation.
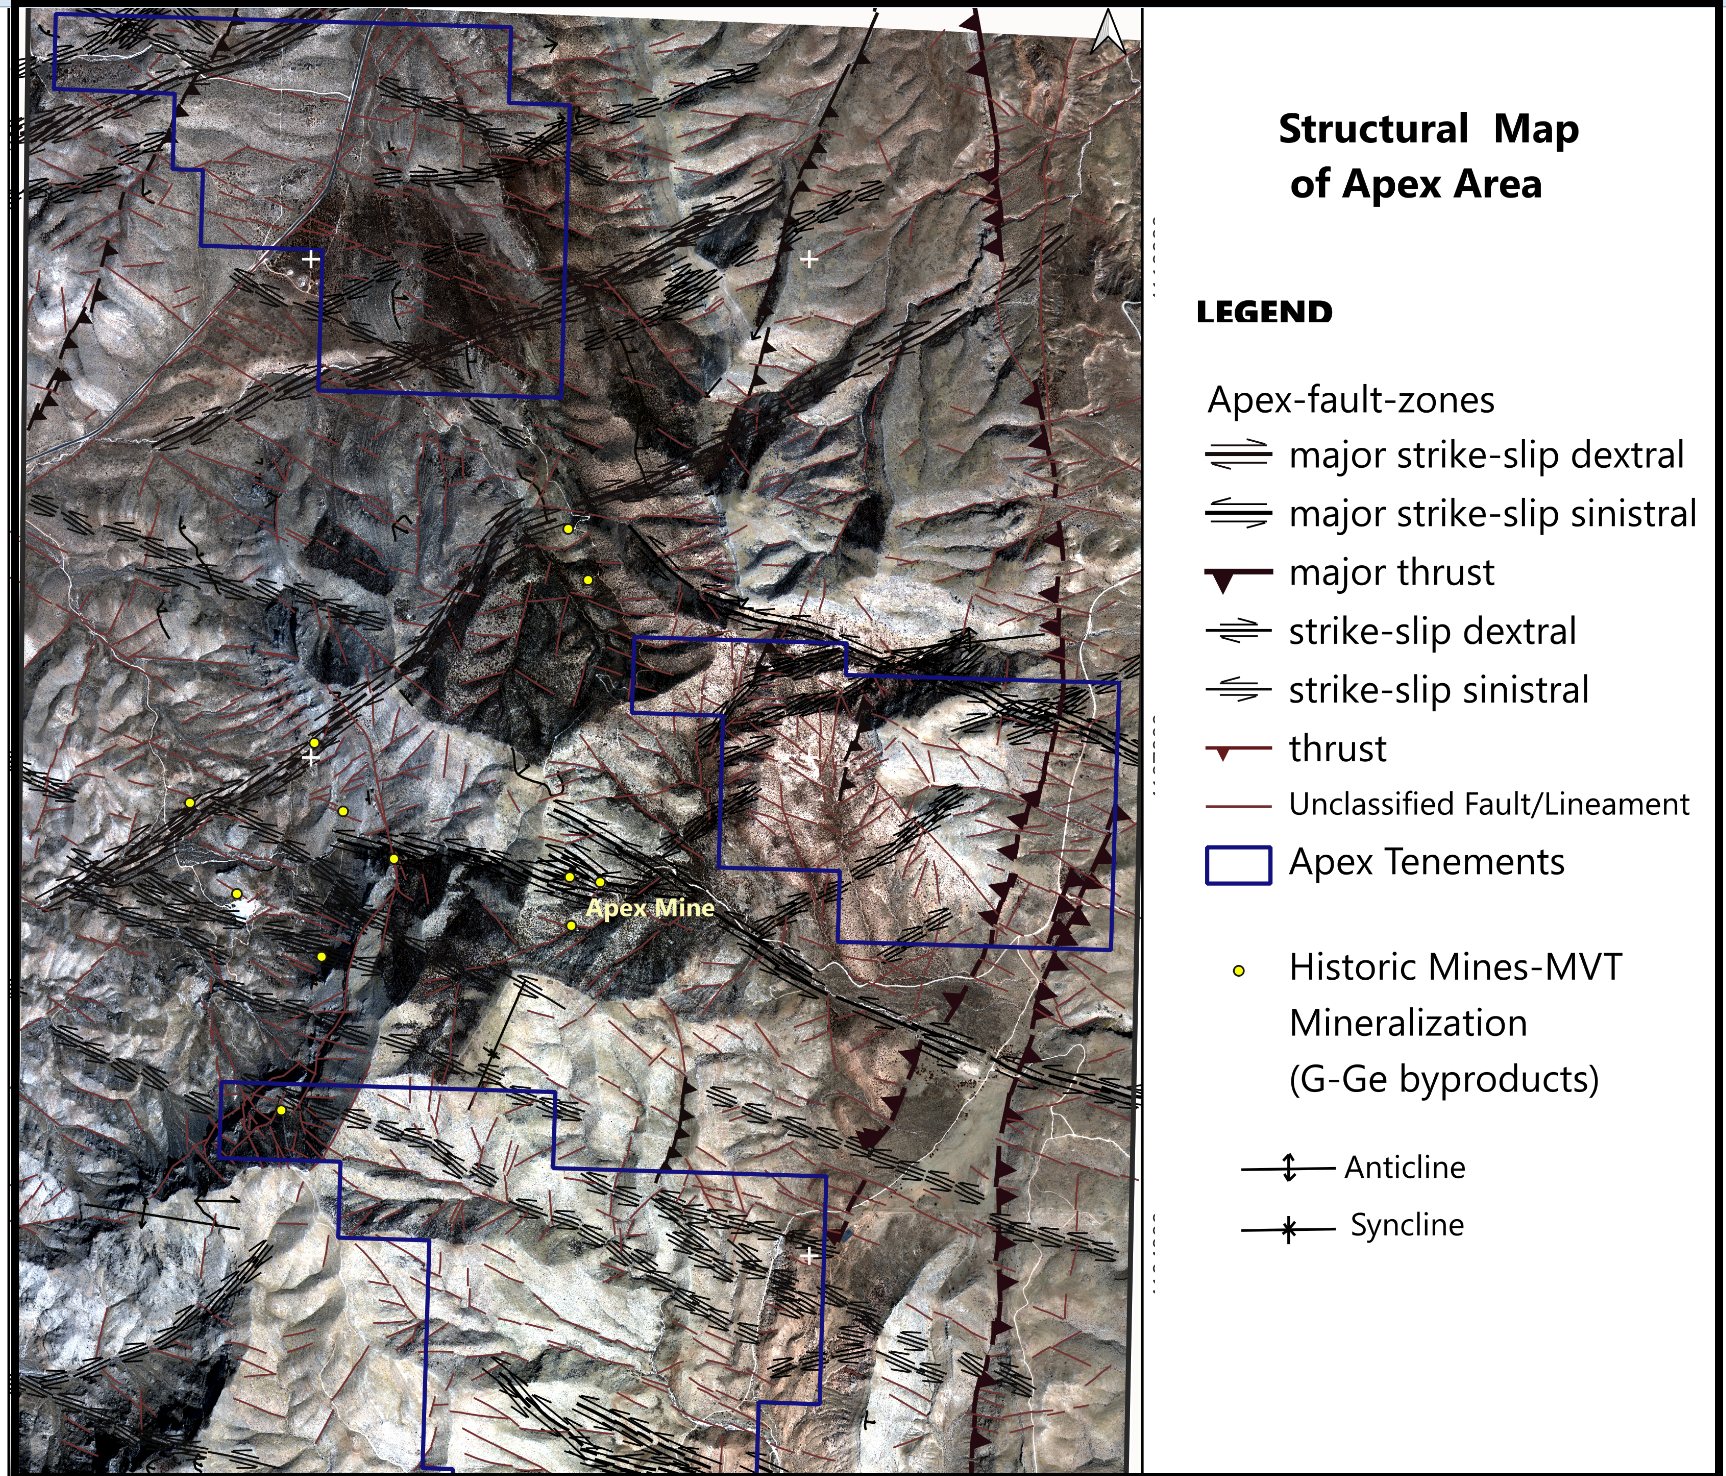
Structural Analysis and Lithological Mapping
Using very high-resolution satellite imagery such as Worldview-3 and NEO Pleiades, together with Lidar data, GeoSpectra provides deeper structural analysis that can be combined with mapped lithological boundaries and alteration minerals to assess mineral prospectivity.
Our workflows allow:
Using medium to very high-resolution satellite data (e.g., EnMap and Worldview-3 panchromatic band)
Using high-resolution LiDAR DEM
Mapping the kinematics of the faults
Mapping lithological boundaries
Integration modelling of the mapped favourable faults and lithologies with remotely sensed mineral maps to generate targets for regional and camp-scale exploration.