
Precious and Base Metals Targeting
Enhancing exploration success through innovative precious and base metals prospectivity assessments.
Targeting Precious and base metals Mineralization
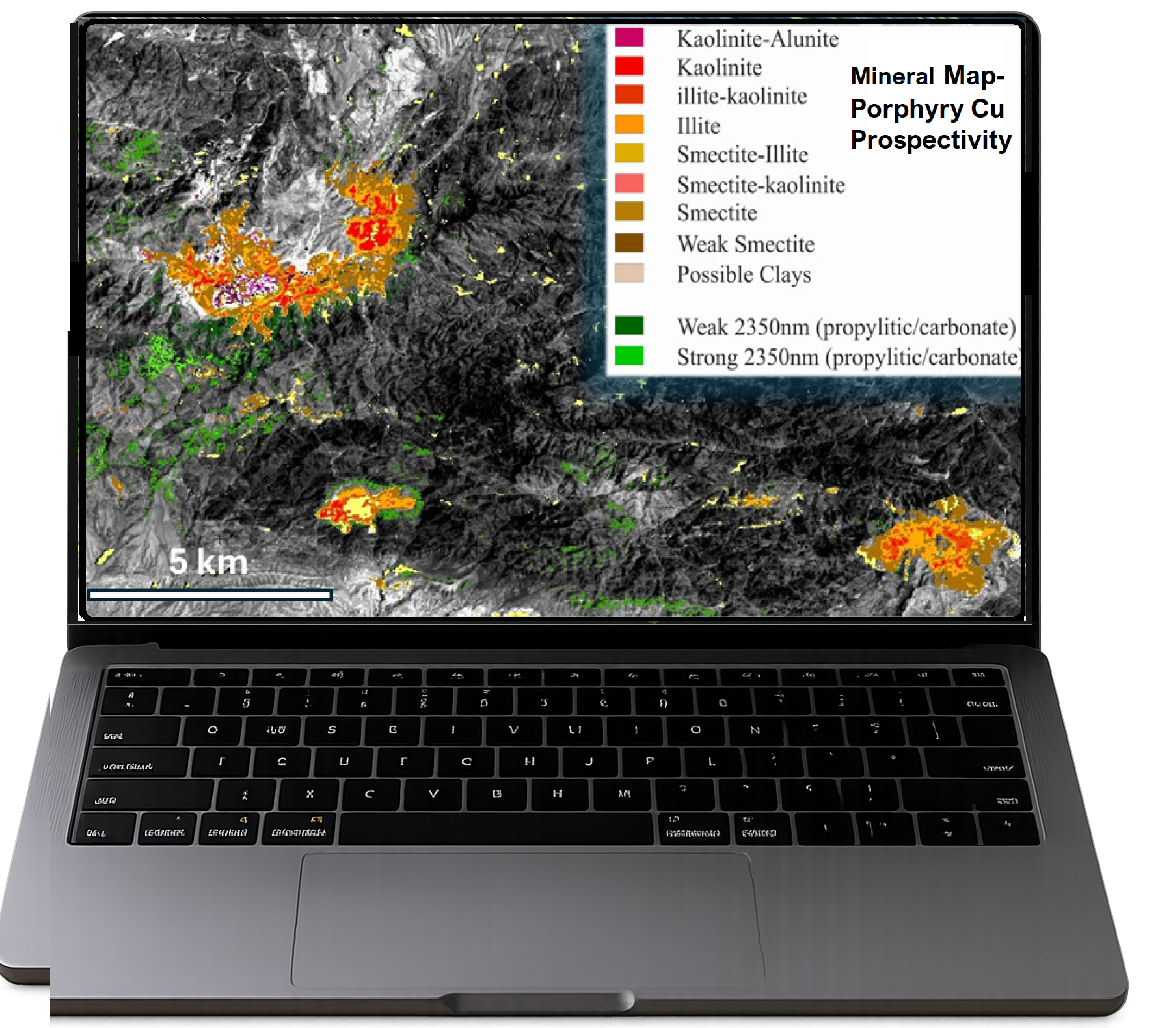
GeoSpectra specialises cutting-edge spectral remote sensing, , exploration data analysis and geospatial modeling to optimize reginal to camp-scale targeting of precious and base metals mineralization (e.g., Cu-Au-Mo porphyry, epithermal gold, IOCG, orogenetic gold, and MVT systems).
Regional Mineral Mapping
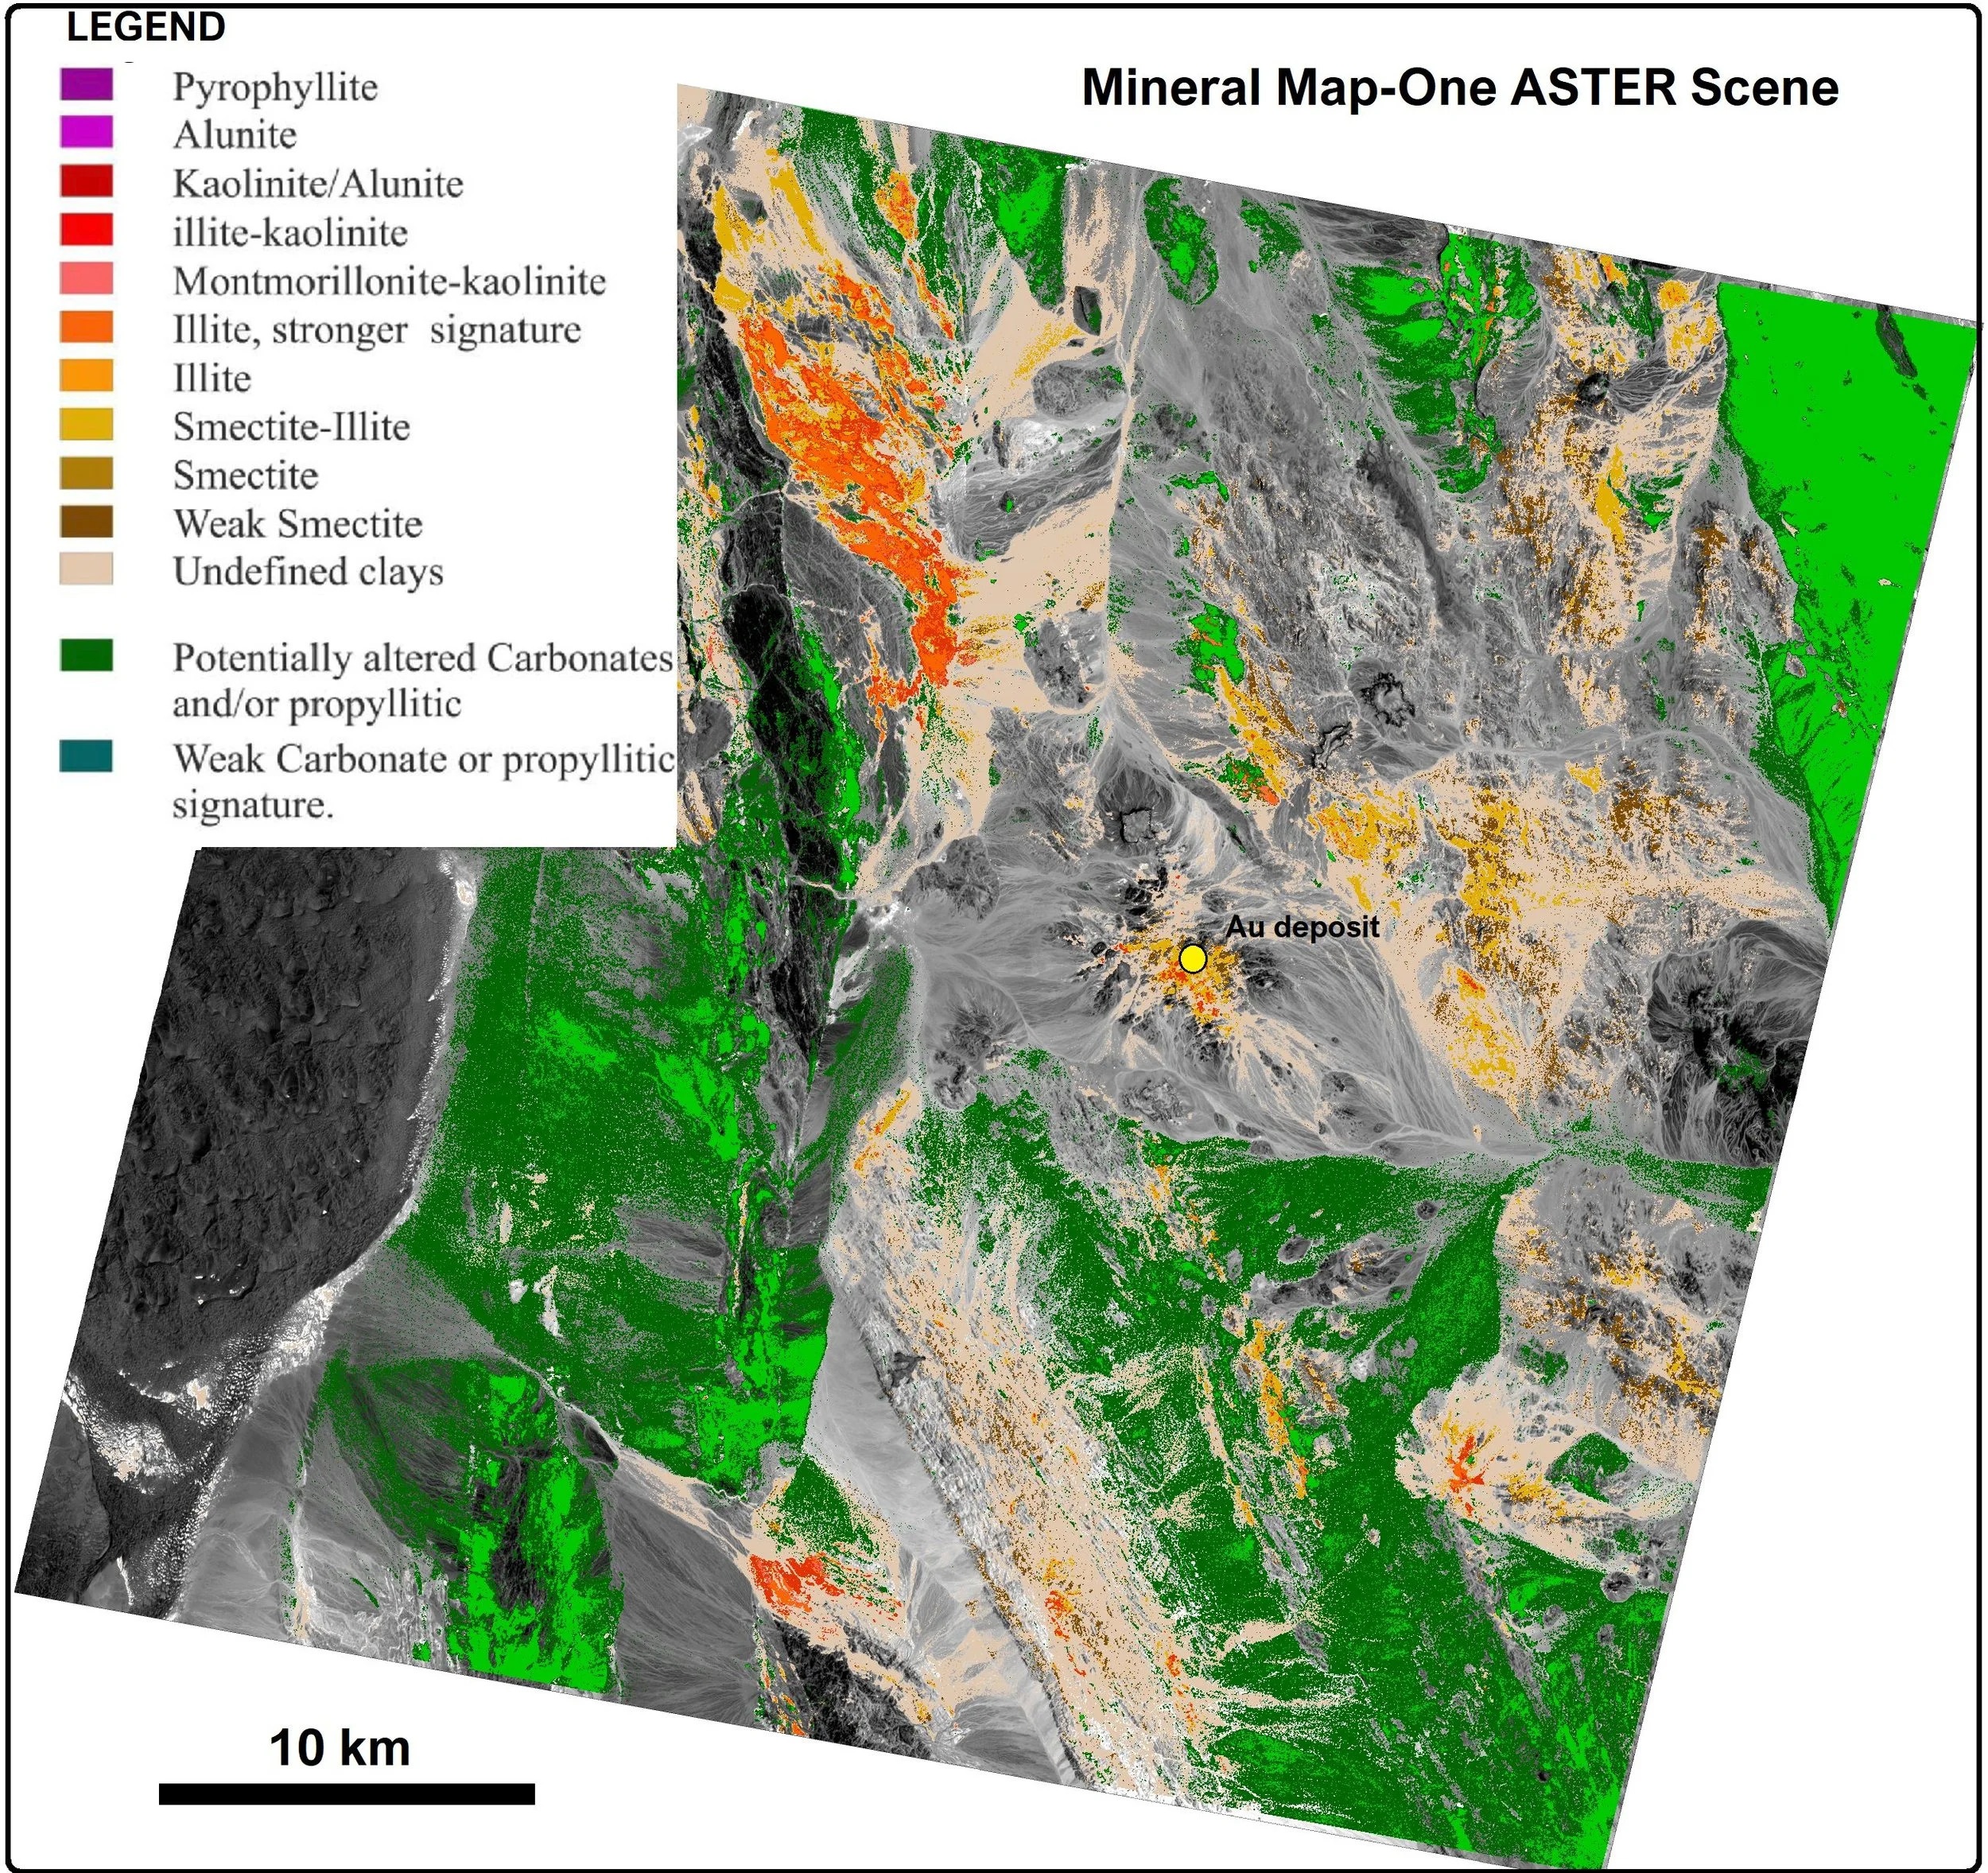
To map the surface footprint of hydrothermal systems for precious and base metals exploration, we provide Mineral Maps derived from satellite imagery such as multispectral ASTER and hyperspectral EnMap. This map identifies distinct alteration mineral zones, tracking key indicators ranging from advanced argillic (e.g., alunite, pyrophyllite) to phyllic/argillic suites (e.g., illite, kaolinite, and smectite) to propylitic halos (chlorite, epidote, and calcite).
Regional Target Generation
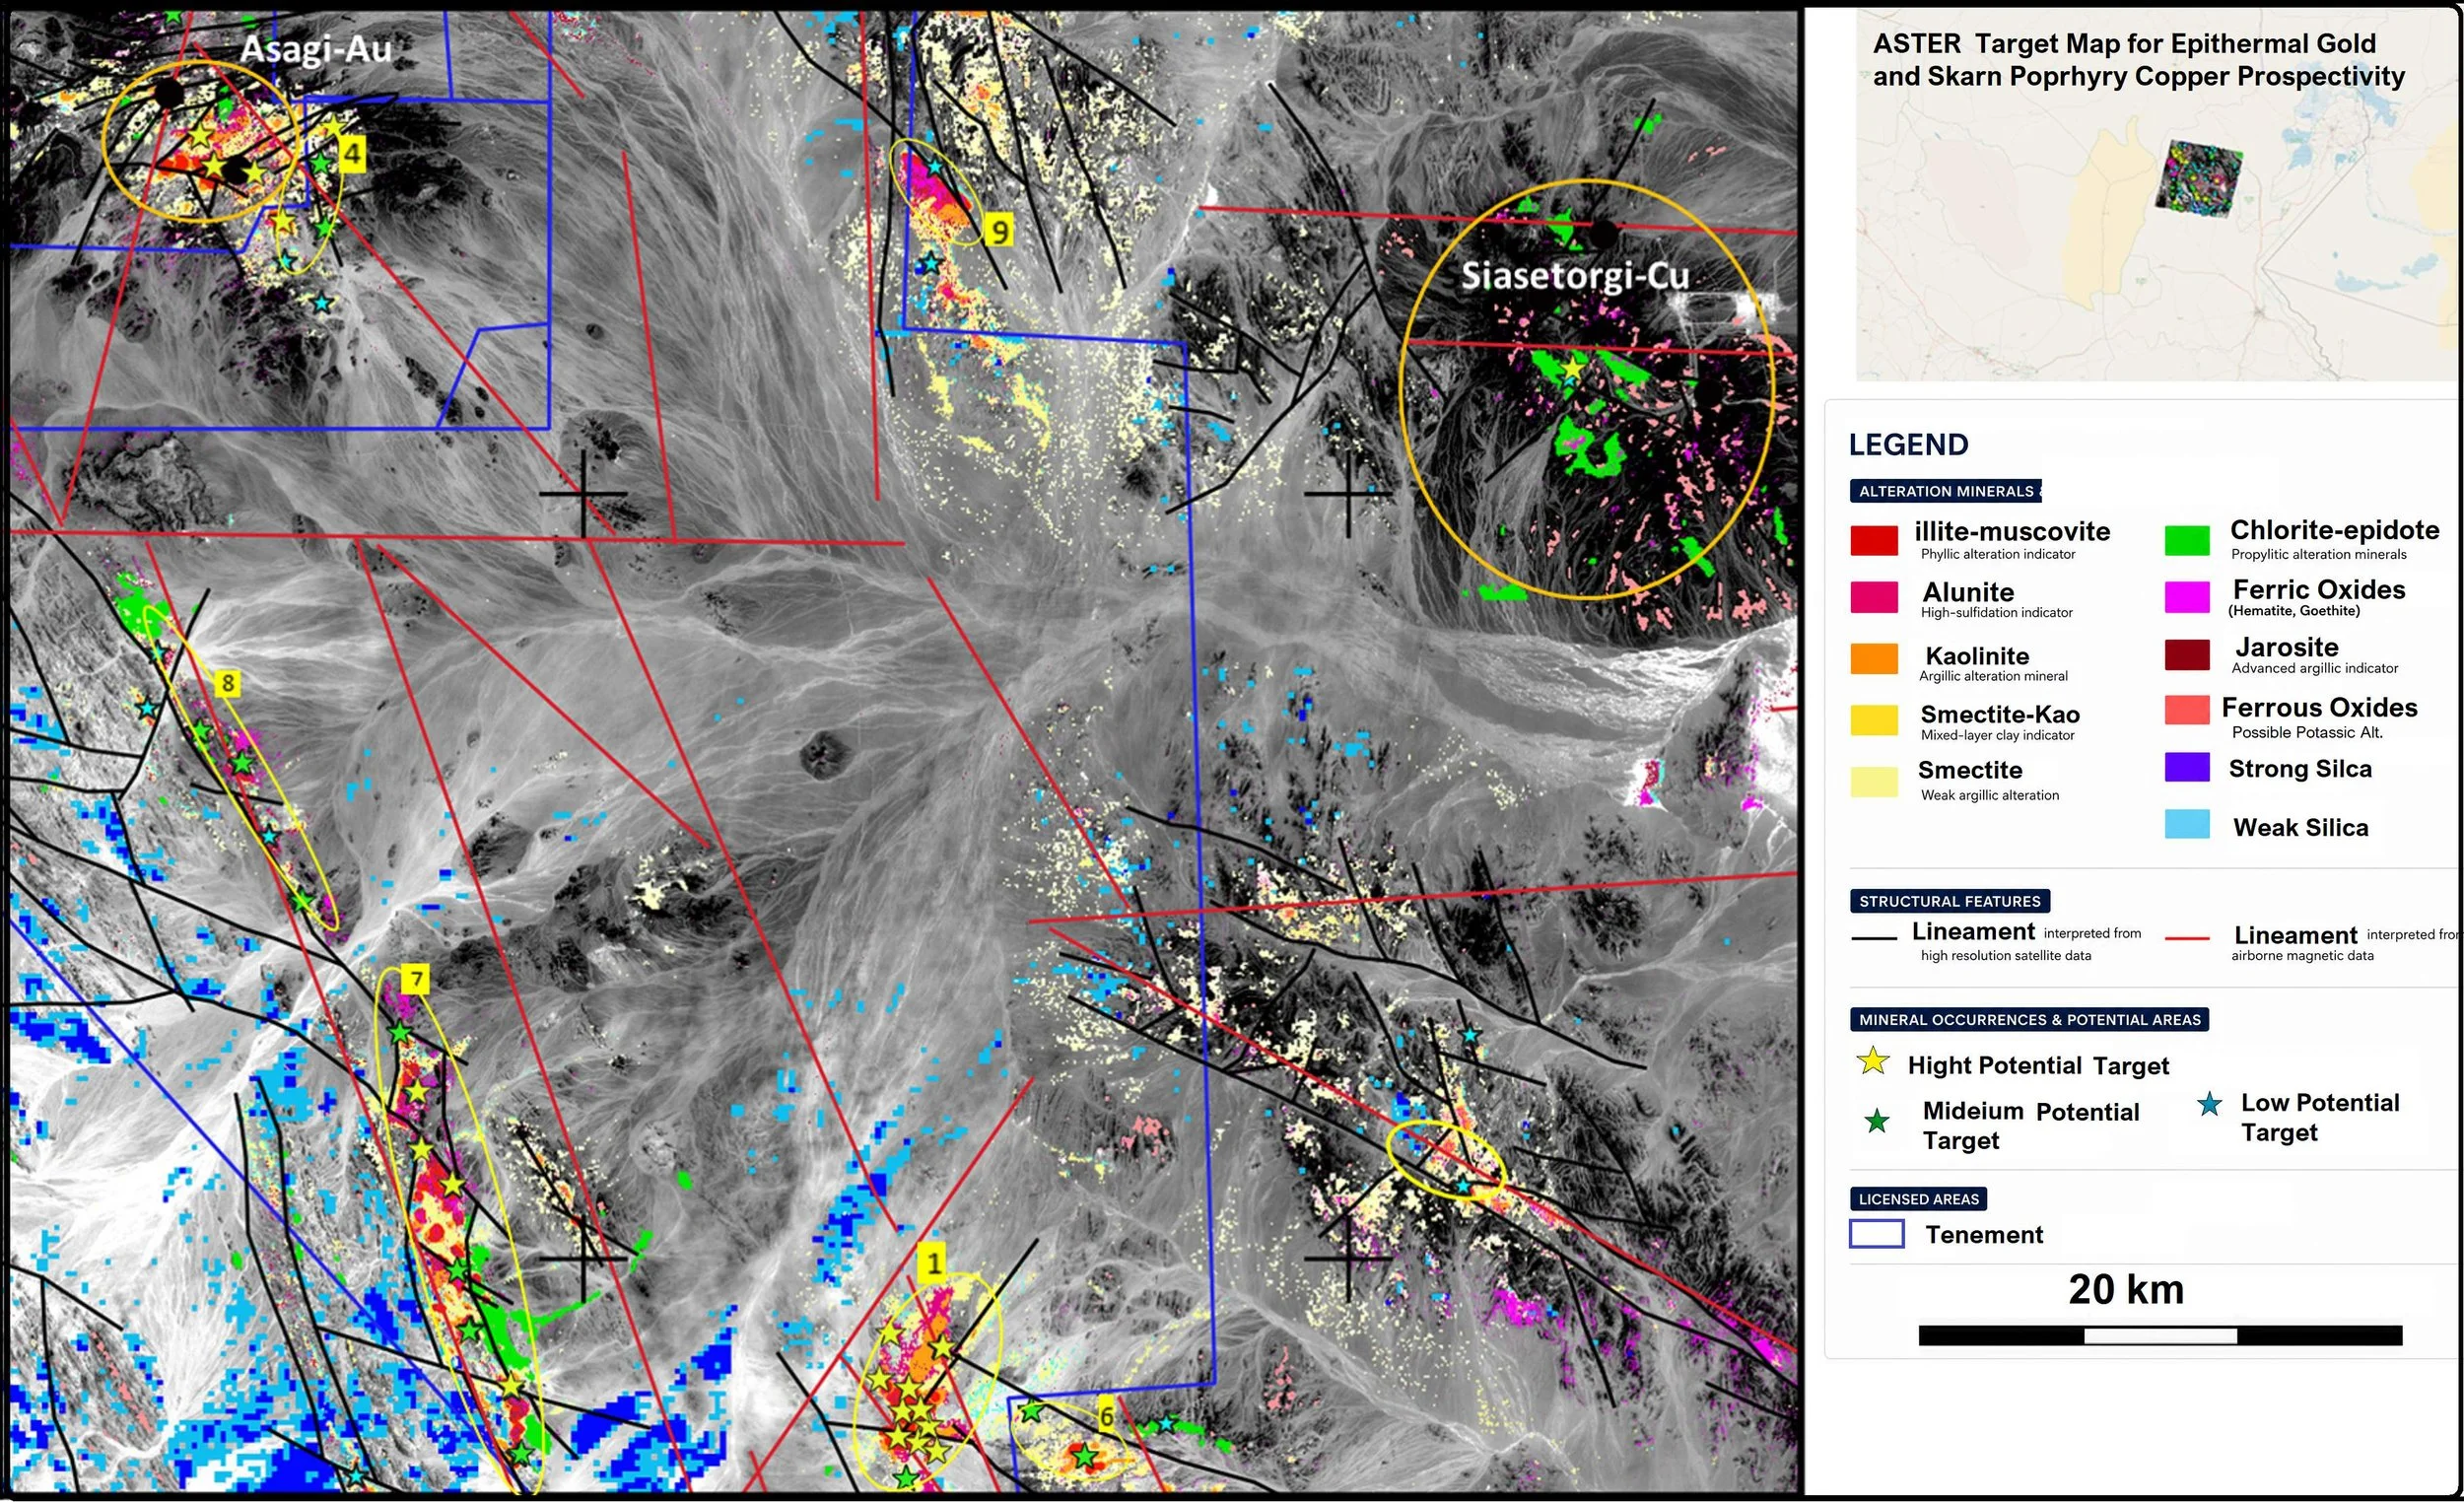
GeoSpectra integrates favorable lithologies, hydrothermal alteration minerals, structures and other exploration data. Where these critical features spatially overlap, the model defines and ranks prospective zones into low to high priority targets such as the highlighted zones surrounding the known gold and copper deposits for similar on-ground exploration.
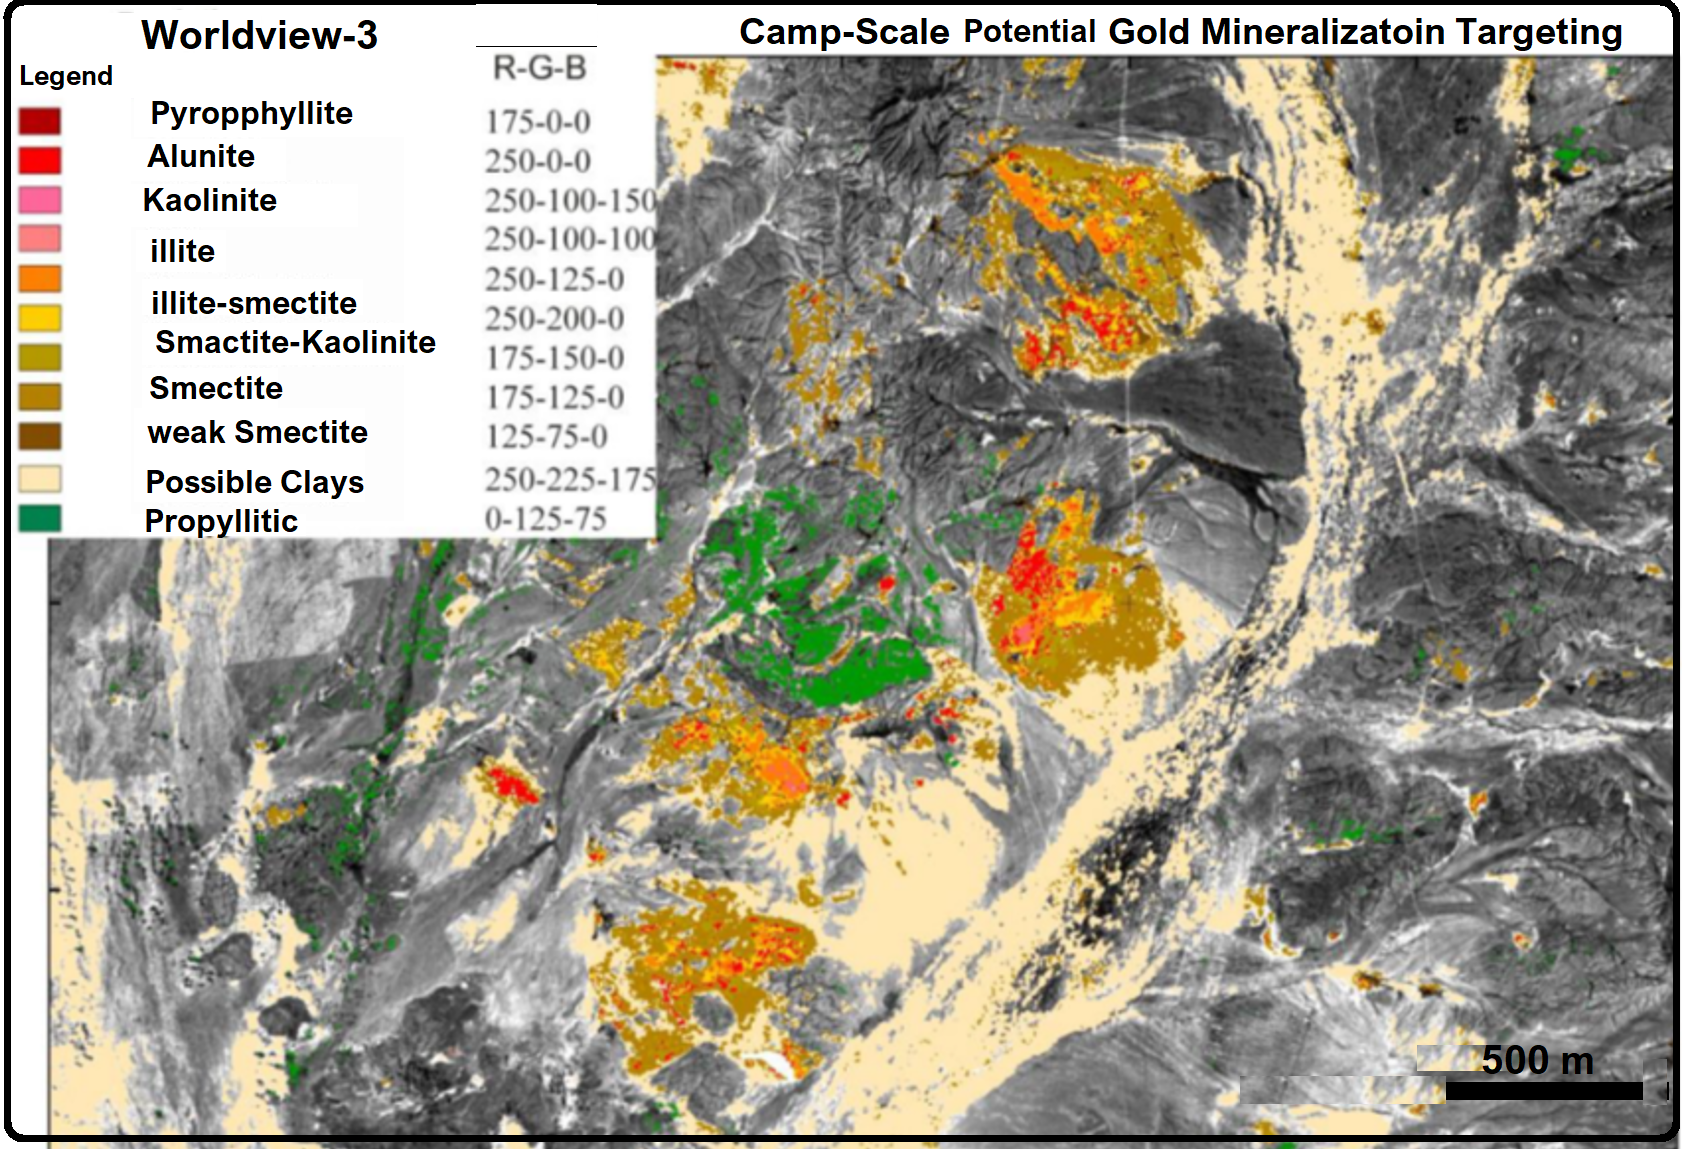
Camp-Scale Mineral Mapping
GeoSpectra delivers advanced analysis of high-resolution Worldview-3 imagery to map key indicator minerals for on-ground camp-scale precious and base metals exploration .
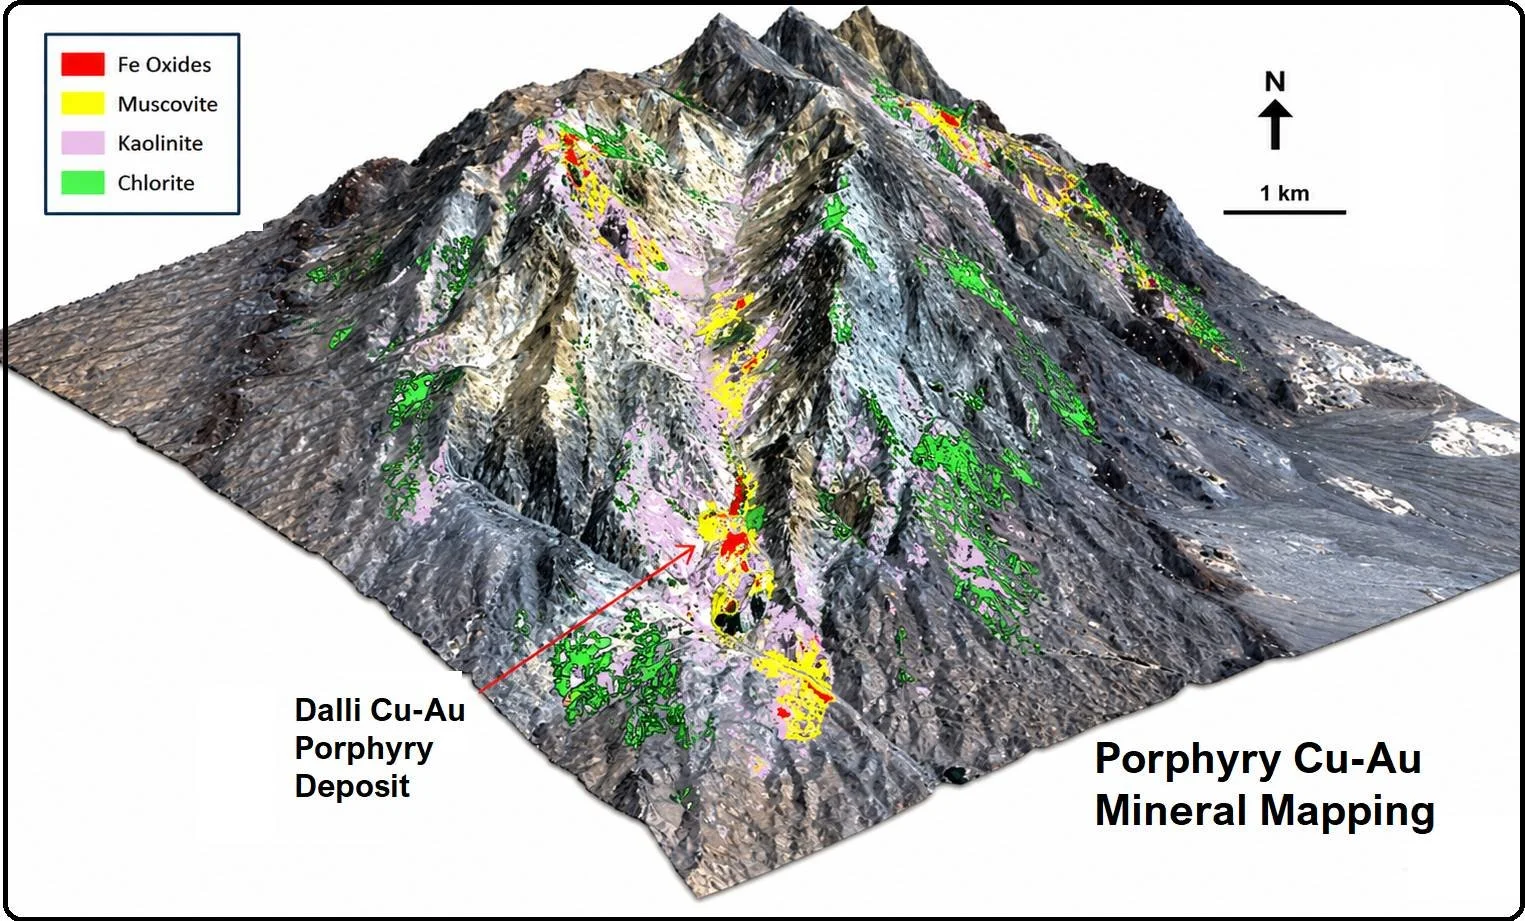
Camp-Scale 3D Mineral Mapping
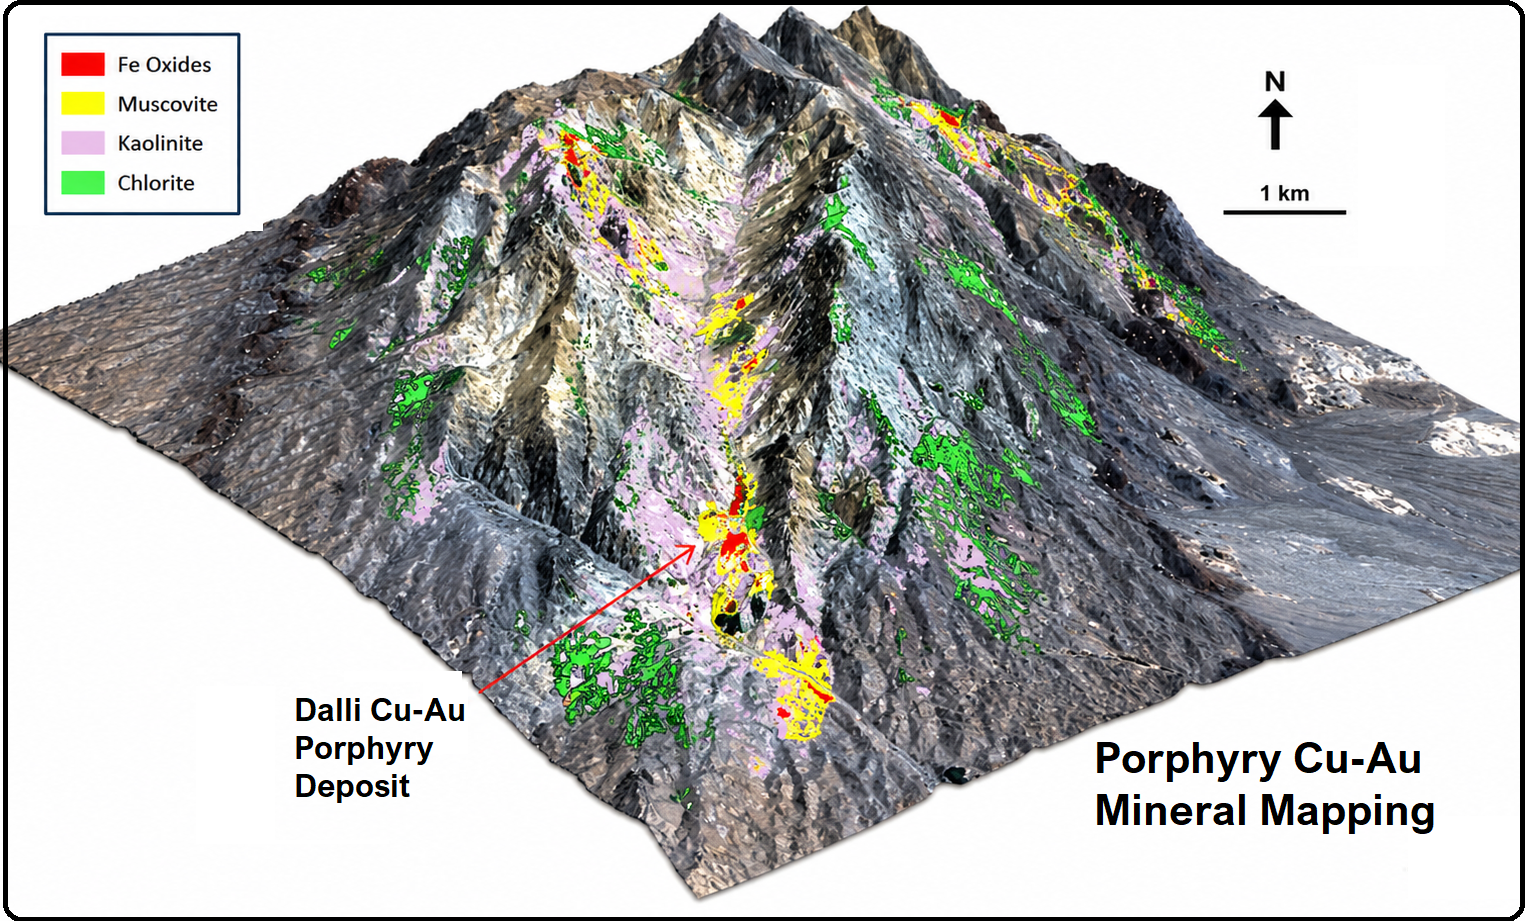
GeoSpectra delivers advanced 3D analysis of high-resolution Worldview-3 imagery to map key indicator minerals in a camp scale on-ground exploration. This 3D WV3 image displays hydrothermal alteration zoning of a typical porphyry Cu-Au system.
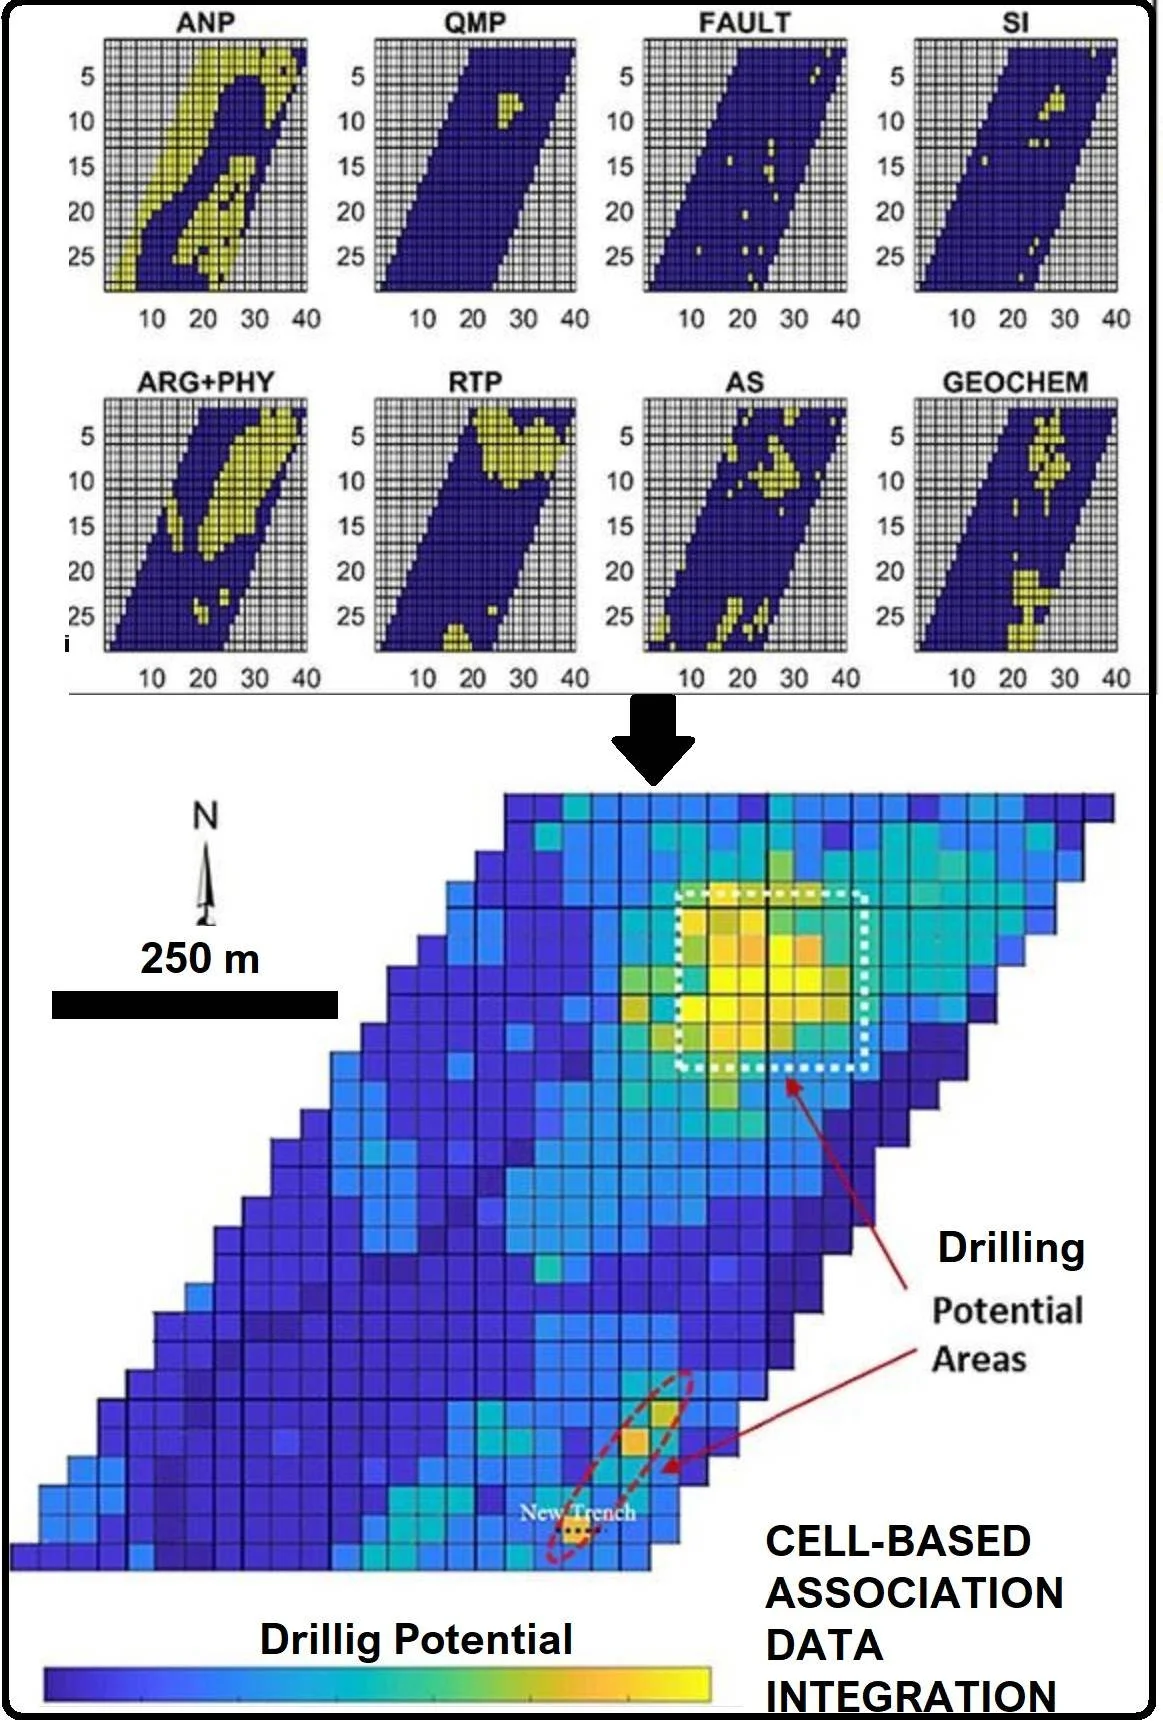
Camp-Scale Data Integration and Scout Drilling Targeting
GeoSpectra analyses deposit-scale geological, geochemical, and geophysical data to identify subtle key indicators exploration features and integrate them by using advanced machine-learning cell-based association to locate favorable preliminary drillings to search for hidden precious and base metals mineralization.
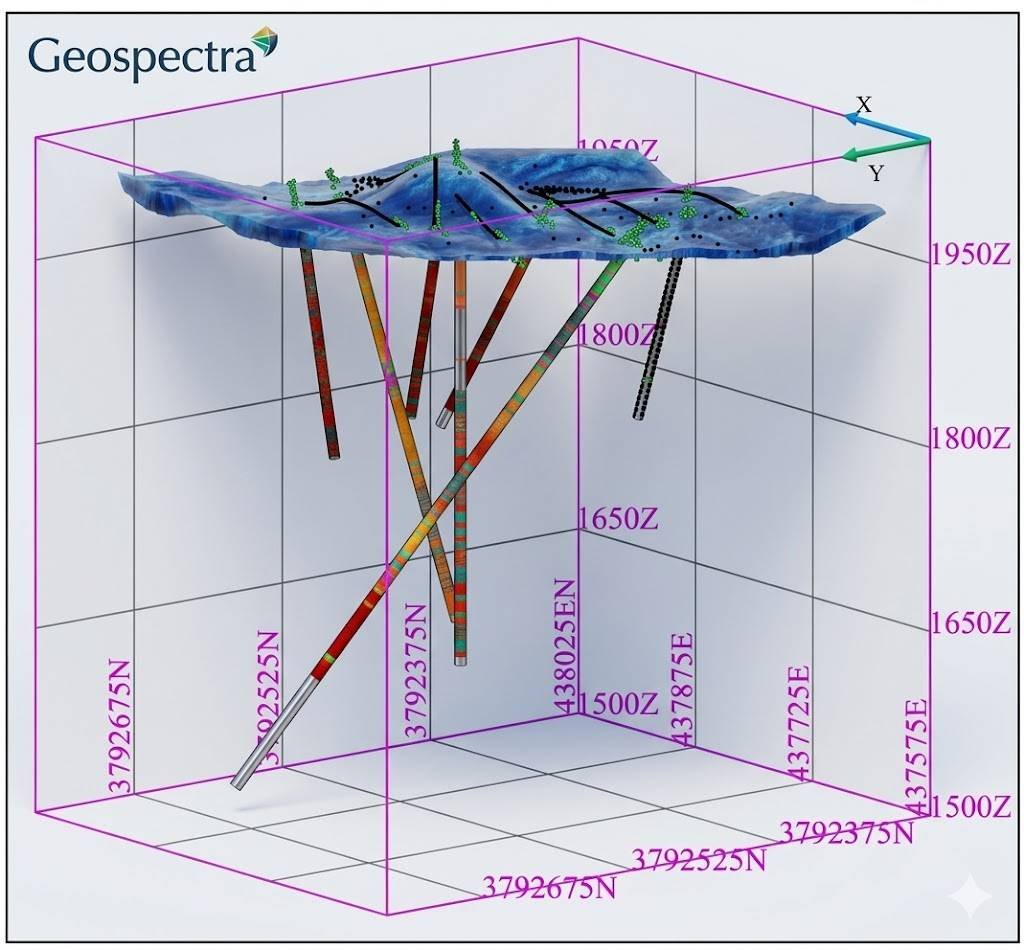
Bore Holes
GeoSpectra applies a semi-supervised machine learning algorithms to merge the favorable surface signatures with 3D borehole assays and lithological logs in various base and precious metal deposits. By analyzing both results simultaneously, our workflow models ore-body continuity—enabling exploration teams to precisely target infill drilling. We then delivers advanced reserve estimation and modelling.