

Hyperspectral Mineral Mapping
GeoSpectra delivers advanced analysis of hyperspectral satellite imagery (EnMAp and PRISMA) to map key alteration minerals of the area’s mineral systems, including favorable clays, sulphates, carbonates and iron oxides for on-ground district-scale exploration.

Unlocking Mineral Detail with Hyperspectral Data
Using hyperspectral datasets with hundreds of spectral bands, GeoSpectra provides deeper mineral insights than conventional methods.
Our workflows allow:
Detection of subtle mineral variations
Accurate separation of overlapping mineral signatures
Enhanced mapping of alteration systems
By combining VNIR and SWIR spectral ranges, we identify critical mineral groups linked to hydrothermal processes and ore formation.
Our Hyperspectral Workflow

Data Processing
We process hyperspectral imagery to extract detailed spectral signatures for accurate mineral identification.

Material Identification
We classify spectral responses to map key mineral groups associated with hydrothermal systems.

Geological Integration
We classify spectral responses to map key mineral groups associated with hydrothermal systems.

EnMAP is a German hyperspectral Earth observation satellite With over 240 spectral bands across the VNIR-SWIR range and 30 m spatial resolution, particularly valuable foganineral exploration because of its high spectral resolution, allowing detailed identification of certain alteration minerals that can not be mapped by multispectral satellite data.
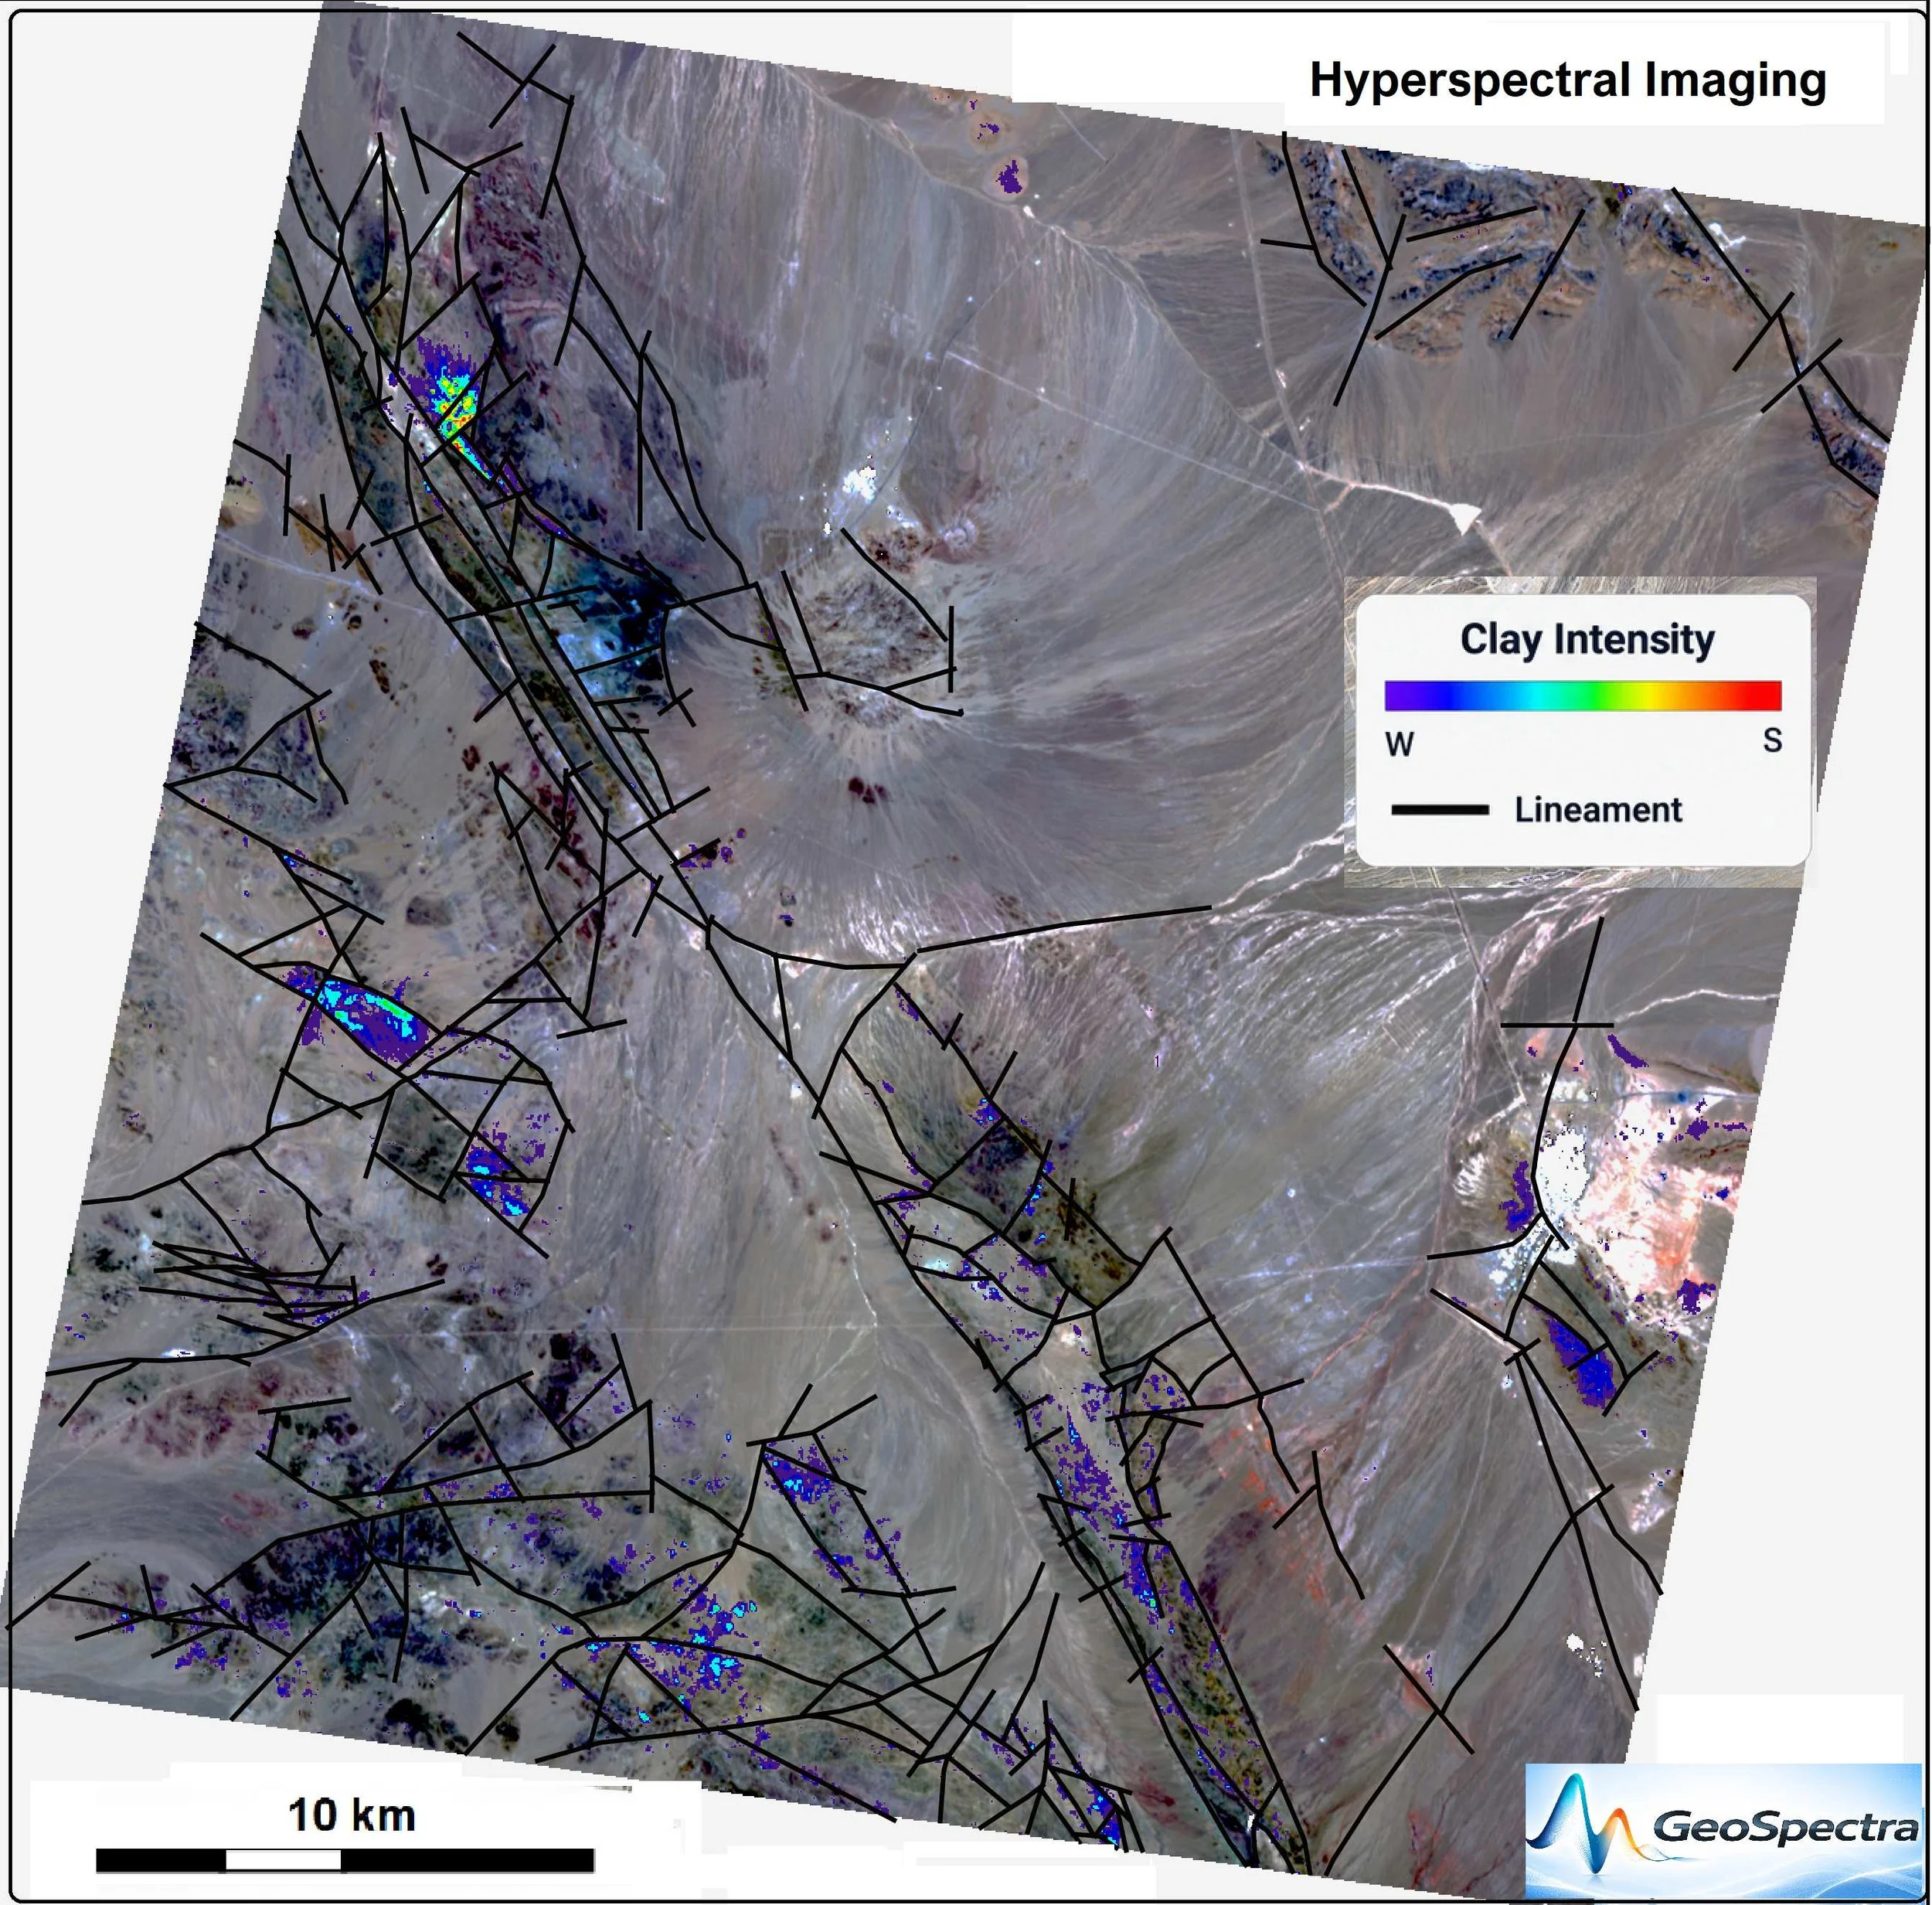
GeoSpectra applies advanced processing of EnMAP hyperspectral satellite
imagery to accurately map hydrothermal alteration mineral intensity (e.g., clays) and lineaments, helping delineate mineralisation footprints.
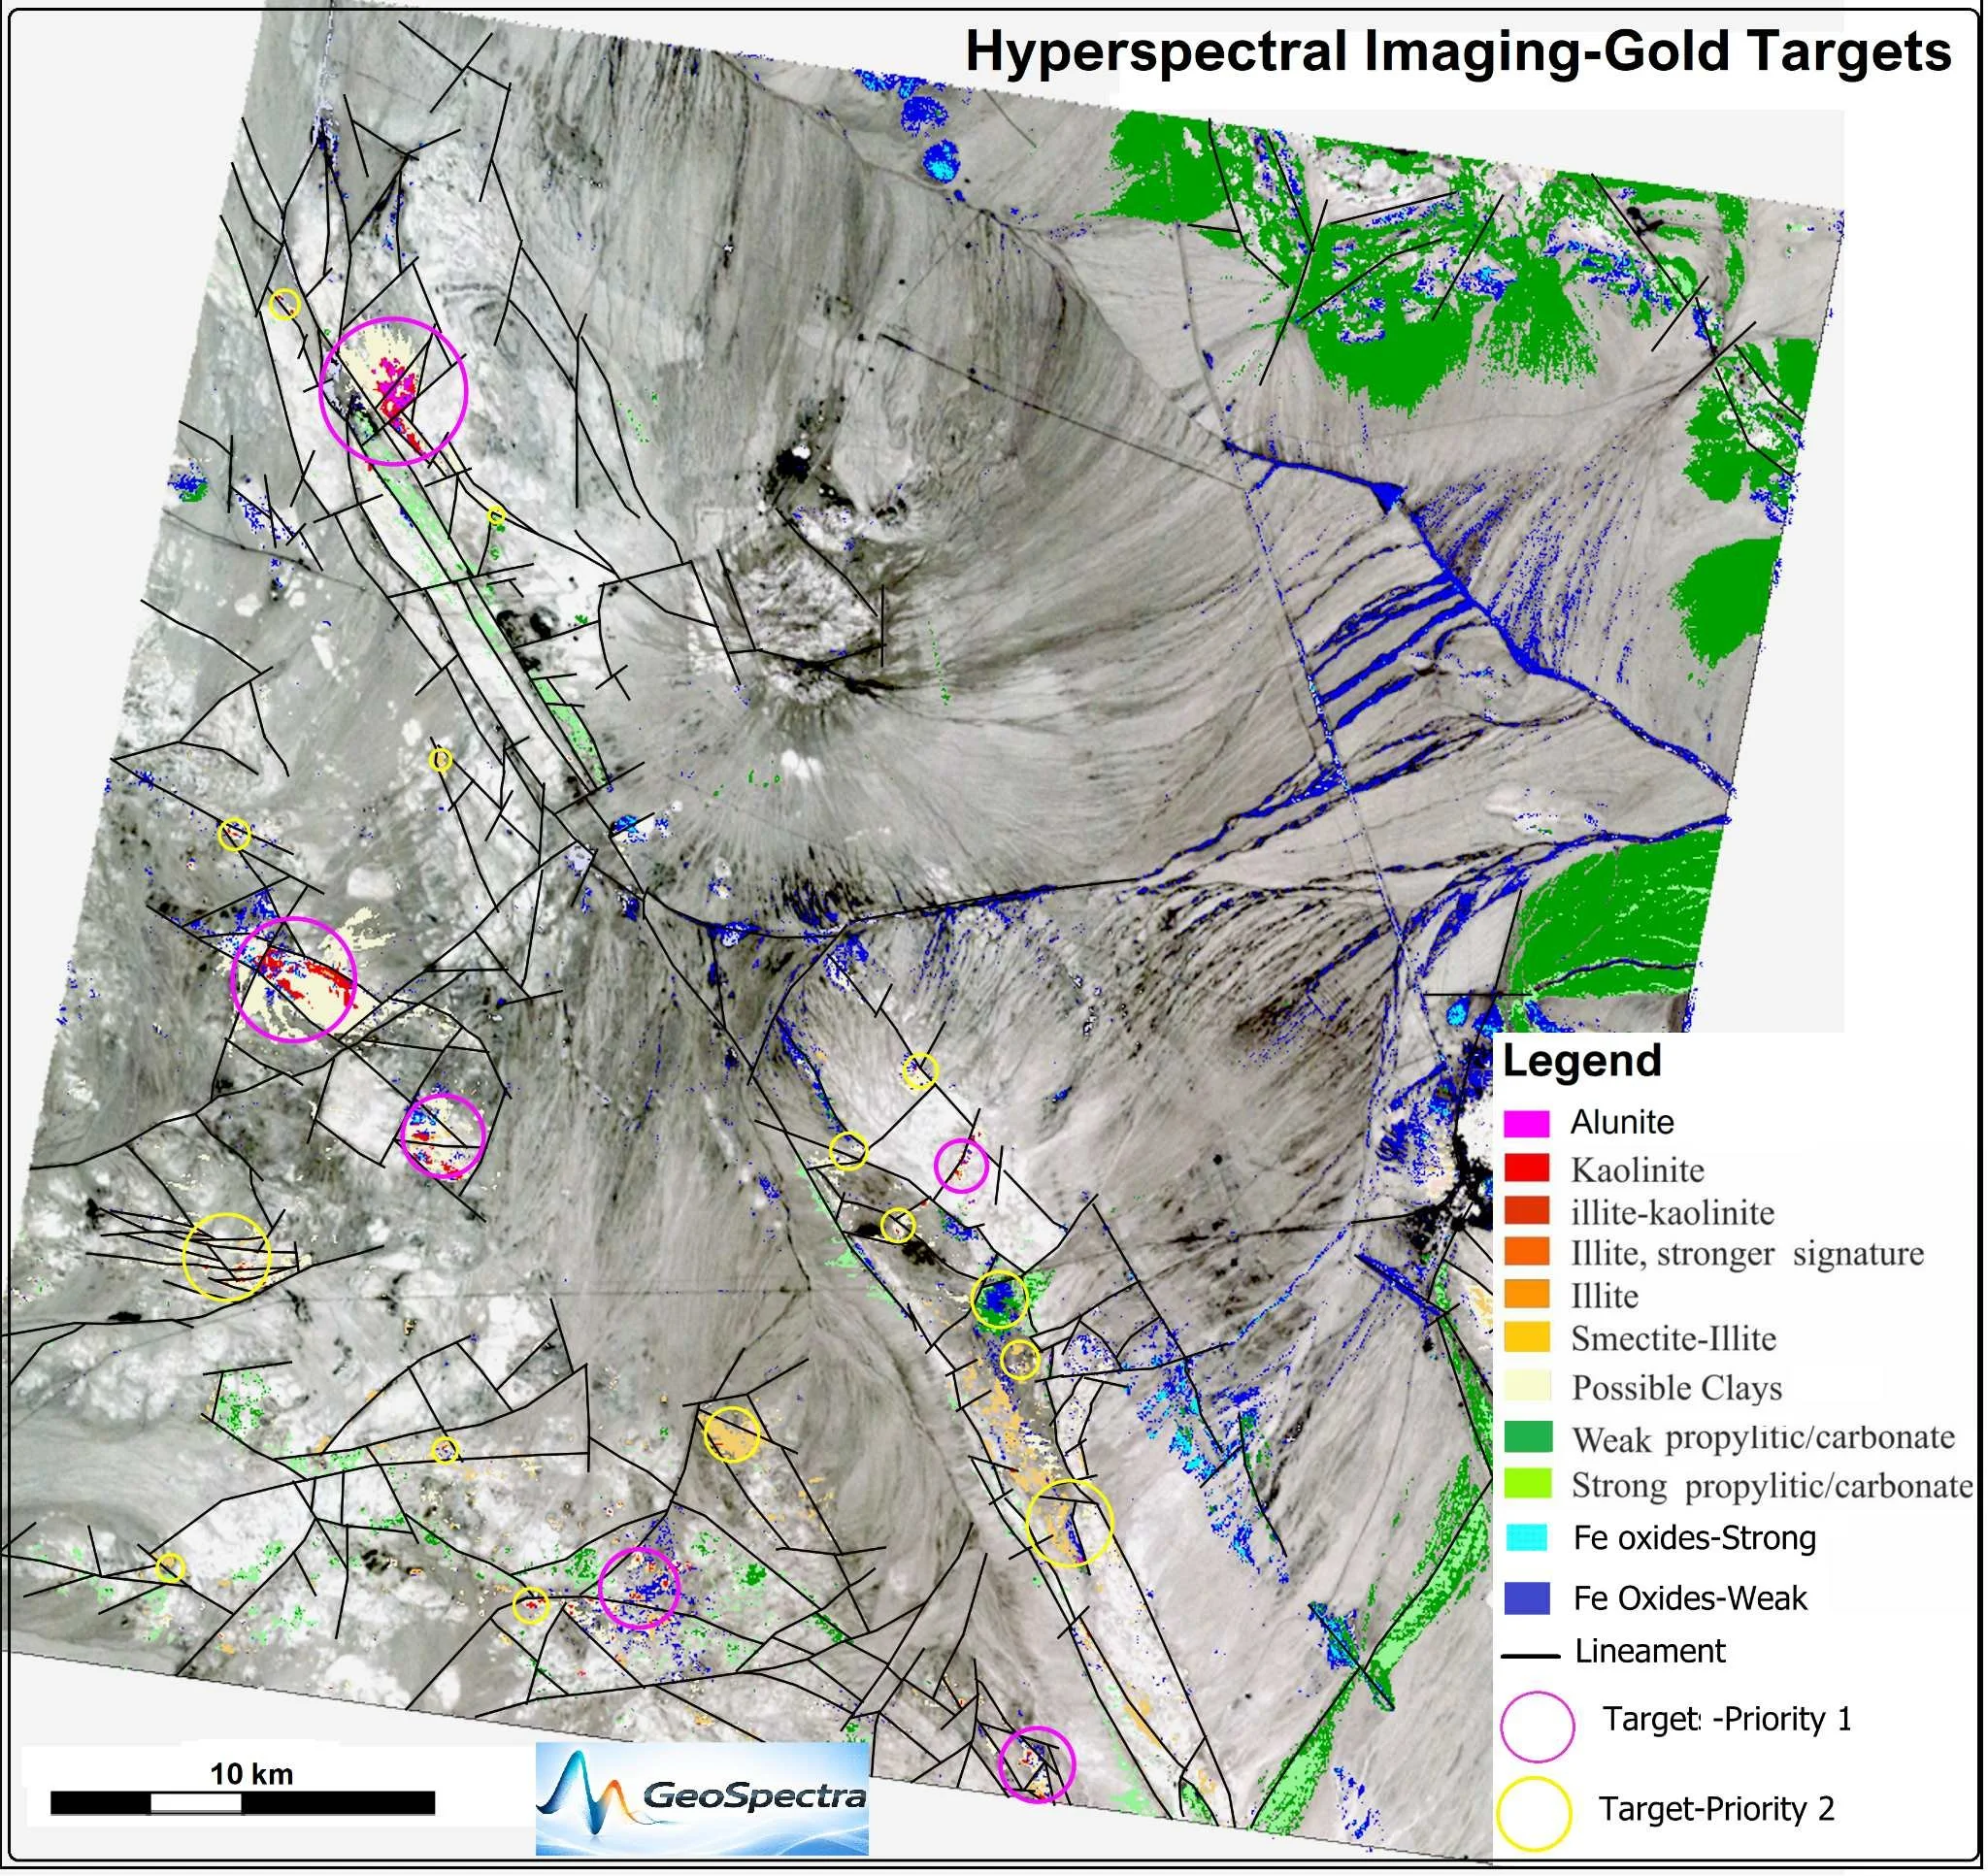
GeoSpectra applies advanced spectral analysis of EnMAP hyperspectral imagery to map key indicator minerals associated with the area's mineral systems, including alunite, pyrophyllite, phengite, favourable clay minerals, ferric and ferrous iron oxides, chlorite, epidote, carbonates (calcite, dolomite, and ankerite), and jarosite. These mineral signatures are integrated with structural architecture, favourable lithologies, and other exploration datasets to identify prioritized mineral targets for district-scale on- ground exploration.

Key Outputs & Capabilities
Detailed mineral mapping, including mineral type, intensity, and alteration zonation
Advanced structural and lineament analysis
Lithological and alteration classification
Customised RGB imagery for multi-purpose geological applications
Mineral prospectivity analysis and target generation
GIS-ready datasets and deliverables for integration into exploration workflows