
Targeting lithium mineralization by analysis of Worldview-3 Imagery (Camp-scale mineral and structural mapping)
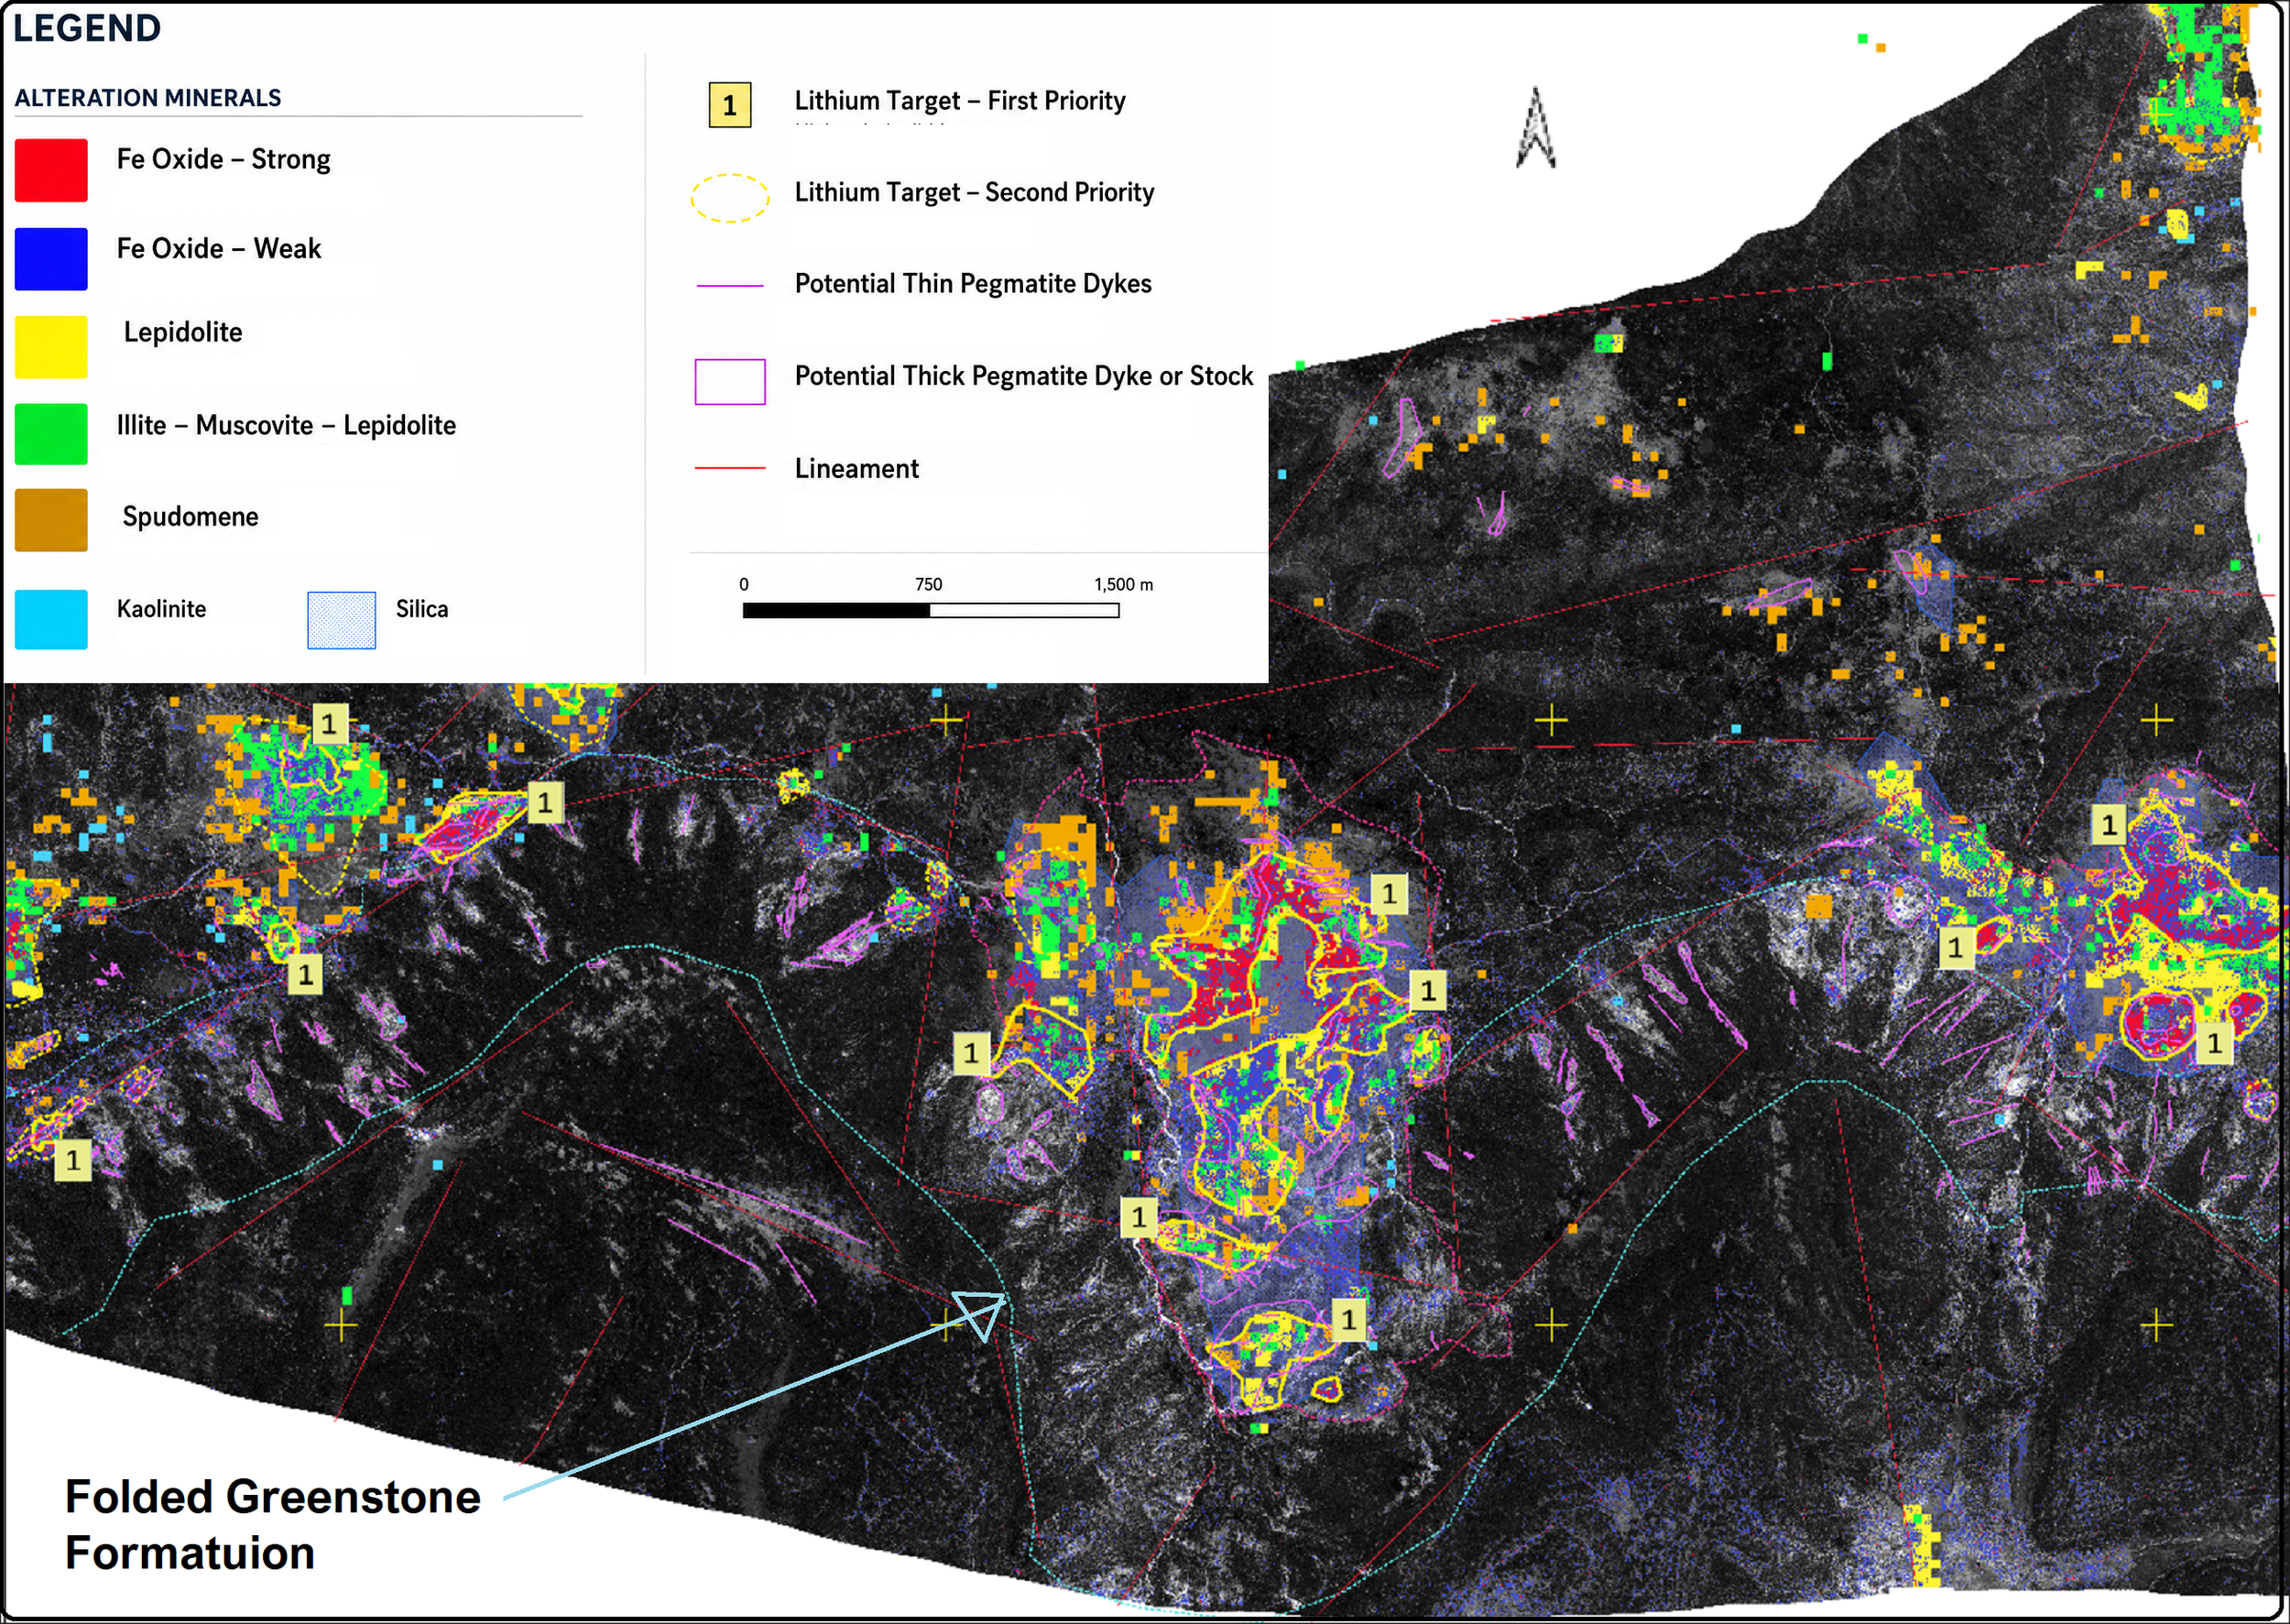
This project utilised high-resolution WorldView-3 multispectral imagery, featuring 30 cm Pan, 1.24 m VNIR and 3.7 m SWIR spatial resolution with 16 spectral bands specifically designed for advanced mineral mapping. The WV-3 dataset was integrated with structural analysis and geological interpretation to identify and prioritise lithium-bearing pegmatite targets across the project area.
The unique combination of high spatial and spectral resolution enabled the detection of diagnostic mineral signatures associated with lithium-rich pegmatites, including lepidolite, spodumene, muscovite, illite, kaolinite, smectite, amorphous silica, and iron oxide minerals. Advanced image processing workflows were applied, including atmospheric correction, spectral enhancement, mineral index generation, and sub-pixel spectral analysis, ensuring accurate mineral discrimination and target delineation.
The interpreted mineralogy was integrated with lineaments, geological features, and pegmatite dykes (mapped by Pan data) to map potential pegmatite dykes and stocks for lithium minerlization. This approach enabled the identification of priority lithium targets based on favourable mineral assemblages, structural controls, and alteration patterns, providing a robust framework for focused field validation and cost-effective lithium exploration.
The final outputs included detailed maps of lithium prospectivity, potential pegmatite dyke corridors, and ranked exploration targets, supporting rapid decision-making and efficient allocation of exploration resources.
Mineral System of the area: Metasomatism Li-bearing pegmatite mineralization
Deliverables (GIS-ready):
Mineral System information of the area of interest (AOI)
Raw image data
Full set of colour composites
Clay Prediction, Silica and Fe oxides (ferric, ferrous and jarosite) prediction Maps (Geo tiff)
2350 micro meters absorption (chlorite, epidote, carbonates) prediction Map
Favorable composite alteration images.
Vectorized alteration maps, with a separate layer for each mineral assemblage (shape files)
Lineament map
Final integrated ranked target map of the remote sensing results
Report (PowerPoint Presentation)